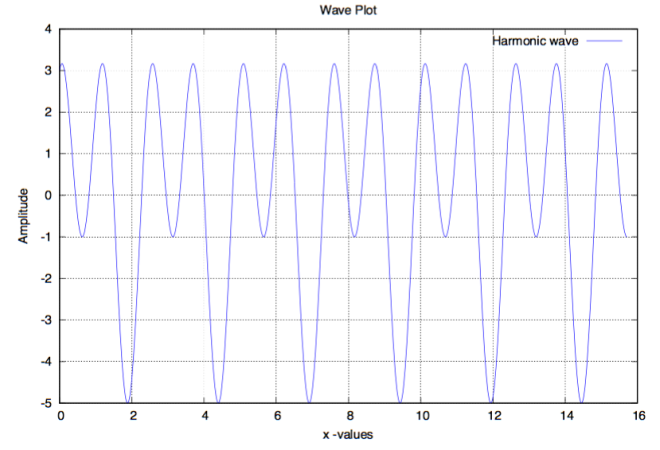
We can use the power of Fortran to do computation of large data set and then we can use Gnuplot to visualize the results. Here, we take a simple example to see how we can do that. Let us take the first example, which we did using the MATLAB. We can do the similar calculation using the Fortran and Gnuplot and Bash.
! Program to calculate the harmonic wave function
program harmonic_wave
 implicit none ! do not assume the data type itself
 integer :: i, n !defining integer data type
 real :: dx, tm !defining real data type
 real, parameter :: pi = 4*atan(1.0) !defining a parameter with fixed value
 real(kind=16), allocatable, dimension(:) :: x, y !defining real array data type with 16 bit size, and allocatable dimension
 real(kind=16), dimension(0:1) :: f, w, TP, lb, k, a !defining real array of size 2

 n=1000 !number of data points
 allocate(x(0:n), y(0:n)) !allocating the size of the arrays
 a(0)=2 !amplitude1
 a(1)=3 !amplitude1
 f(0)=5 !frequency1
 f(1)=10 !frequency2
 TP(0:1)=1/f(0:1) !time period
 w(0:1)=2*pi*f(0:1) !angular frequency
 lb(0:1)=2*TP(0:1) !wavelength
 k(0:1)=1/lb(0:1) !wavenumber
 tm=2 !time


 dx=pi/200 !increment
 x(0:n) =[(i*dx, i=0,n)] !x values
 y(0:n)=a(0)*sin(k(0)*x(0:n)-w(0)*tm) + a(1)*cos(k(1)*x(0:n)-w(1)*tm); !waveform
 open(unit=1, file='wavedata.dat') !opening a file for writing data
 do i=0,n !do loop
 !print 11, i, x(i), y(i) !printing output on the terminal
 write(1,10) x(i), y(i) !writing in the file
 10 format(f8.4, f8.4) !format for writing in the file
 11 format(i4, " x: ", f8.4, " y: ", f8.4) !format for output on the terminal
 end do
 close(1) !close the file
 deallocate(x, y) ! deallocates the array
end program harmonic_wave
Let us save this in the file called “simple_wave_model.f”.
For compiling, we can use gfortran and use free-form source. If the file extension is .f90, then gfortran by default consider it to be free form source, otherwise it consider it to be a fixed form. We can overwrite this by giving extra argument of “-ffree-form”.
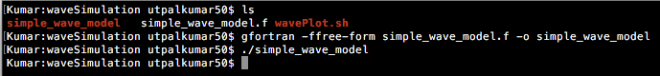
In the command line, we typed first command to compile the program and the next one to run it. We can write these sets of program in bash script and make it more general. We can also add the commands for plotting the results using gnuplot in the bash script.
#!/bin/bash
prog="simple_wave_model.f" #fortran program name
exect=`echo $prog | cut -d"." -f1` #executable name

rm -f *.ps *.png *.eps $exect #remove files


gfortran -ffree-form $prog -o $exect #compiling the fortran program
./$exect #running the executable


###GNUPLOT parameters
fignm="waveplot.ps" #figure name for the plot
figtitle="Wave Plot" #figure title
datafile="wavedata.dat" #data file name

##Deciding output figure format (ps or png) NOTE: there are many more formats available
figtype=`echo $fignm | cut -d"." -f2`
if [ "$figtype" == "ps" ]; then
figformat=postscript
elif [ "$figtype" == "png" ]; then
figformat=png
fi

#######GNUPLOT
gnuplot << EOF
fignm=system("echo $fignm")
figtitle=system("echo $figtitle")
datafile=system("echo $datafile")
figformat=system("echo $figformat")

subt1='Harmonic wave'
xlb="x -values"
ylb="Amplitude"
set terminal postscript color solid #terminal type
set title figtitle #figure title
set xlabel xlb #xlabel
set ylabel ylb #ylabel
set output fignm #output fig name
set grid #grid
plot [:] [:] datafile using 1:2 title subt1 with lines lc rgb 'blue' #plotting the figure
EOF

open $fignm #opening the figure for Mac user
#gs $fignm #opening figure using ghostviewer
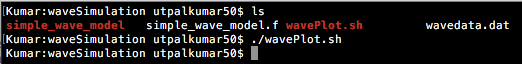
Save the above file as “wavePlot.sh” and change the permission using the “chmod” command.
-Utpal Kumar, IES, Academia Sinica
