Simple 1D velocity model inversion from P arrival time

Refer to Chapter 5, Introduction to Seismology, Shearer 2009.

Problem:

From the P-wave travel time data below (note that the reduction velocity of 8km/s), inverse for the 1D velocity model using T(X) curve fitting (fit the T(X) curve with lines, then invert for the ray parameter p and delay time τ(p), then solve for the velocity and depth).


screenshot-from-2016-12-27-16-58-38
Fig 1. P-wave travel time from a seismic experiment.


Solution:

We construct the T(X) plot from the data: y = T  – X/8 => T = y + X/8 and then divide the T(X) curve into fitting lines (Fig. 2).

ex5-1fit
Fig 2. T(X) plot with lines fitting to data points.

The ray parameter and delay is calculated for each line by using:

p = dT/dX

τ = T – pX

These parameters p and τ are slope and intercept of a line, respectively.

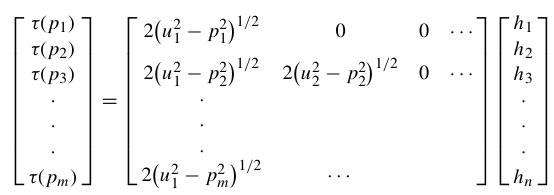
The τ(p) can be written as:

Screenshot from 2016-12-27 17-14-52.png

as in the matrix form of:

Screenshot from 2016-12-27 17-14-57.png

or, in short,

We can invert for the thickness of each layer using least square inversion:

If we assume ray slowness u(i) = p(i) for each line, we can solve the h and v for the 1D velocity model.

Here is the result of the inversion:

ex5.1v_model.png

The sharp increase in Vp from ~6.6 km/s to 7.7 km/s at ~ 30km depth suggest for the Moho discontinuity.

The codes for the problem is written in python and can be downloaded: source codeτ inversion code, data points.

Nguyen Cong Nghia, IESAS


Ray tracing through a 1-D velocity model

Refer to Chapter 4 of Shearer, Introduction to Seismology.

screenshot-from-2016-12-21-16-39-44

For a ray piercing through Earth, the ray parameter (or horizontal slowness) p is defined by several expressions:

Screenshot from 2016-12-21 16-38-07.png

where u = 1/v is the slowness, θ is the ray incidence angle, T is the travel time, X is the horizontal range and utp is the slowness at the ray turning point.

Screenshot from 2016-12-21 16-37-05.png

The vertical slowness is defined as:

screenshot-from-2016-12-21-16-40-40

and integral expressions for the surface-to-surface travel time are:

Screenshot from 2016-12-21 16-41-26.png

Screenshot from 2016-12-21 16-41-32.png

With these equations we can calculate the travel time (T) and horizontal distance (X) for a given ray with ray parameter p and velocity model v(z).

Apply these to a problem (Exercise 4.8 Shearer):

(COMPUTER) Consider MARMOD, a velocity-versus-depth model, which is typical of much of the oceanic crust (Table 4.1). Linear velocity gradients are assumed to exist at intermediate depths in the model; for example, the P velocity at 3.75 km is 6.9 km/s. Write a computer program to trace rays through this model and produce a P-wave T(X) curve, using 100 values of the ray parameter p equally spaced between 0.1236 and 0.2217 s/km. You will find it helpful to use subroutine LAYERXT (provided in Fortran in Appendix D and in the supplemental web material as a Matlab script), which gives dx and dt as a function of p for layers with linear velocity gradients. Your program will involve an outer loop over ray parameter and an inner loop over depth in the model. For each ray, set x and t to zero and then, starting with the surface layer and proceeding downward, sum the contributions, dx and dt, from LAYERXT for each layer until the ray turns. This will give x and t for the ray from the surface to the turning point. Multiply by two to obtain the total surface-to-surface values of X(p) and T(p). Now produce plots of: (a) T(X) plotted with a reduction velocity of 8 km/s, (b) X(p), and (c) τ(p). On each plot, label the prograde and retrograde branches. Where might one anticipate that the largest amplitudes will occur?

Screenshot from 2016-12-21 21-32-25.png

Using the LAYERXT subroutine (Appendix D of Shearer), the FORTRAN and MATLAB can be downloaded from here. In this example, we will use python to calculate and plot the result.

ex4-8-1ex4-8-2ex4-8-3


The main program is as follow:

from ttcal import layerxt
import pandas as pd
import numpy as np
import matplotlib.pyplot as plt

v_model = pd.read_csv('v_model.dat')

p1 = 0.1236
p2 = 0.2217
n = 100

result = [['p','X','T']]
for p in np.linspace(p1, p2, n):
    X = 0; T = 0;
    for i in range(0, len(v_model)-1):
            p = p
            h = v_model.h[i+1] - v_model.h[i]
            utop = 1/v_model.vp[i]
            ubot = 1/v_model.vp[i+1]
            dx, dt, irtr = layerxt(p,h,utop,ubot)
            X += dx; T += dt
        #If the ray reflected at layer the dx, dt calculation stops
            if irtr == 2:
                    break
        result.append([p,X,T])

result_df = pd.DataFrame(result, columns=result.pop(0))
result_df = result_df[::-1]

#Multiply by 2 to get total surface-to-surface value ot X(p) and T(p)
result_df['T'] = 2*result_df['T']
result_df['X'] = 2*result_df['X']

plt.figure(1)
result_df['RT'] = result_df['T']-result_df['X']/8
result_df.plot(x='X', y='RT', legend=False)
plt.title('Reduction time')
plt.ylabel('Reduce time T - X/8 (s)')
plt.xlabel('Distance (km)')
plt.text(20,0.80,'Prograde', rotation =40)
plt.text(40,1.6,'Retrograde', rotation =35)
plt.text(80,1.00,'Prograde', rotation =0)
plt.savefig('ex4.8.1.png')

plt.figure(2)
result_df.plot(x='p', y='X', legend=False)
plt.title('X(p)')
plt.ylabel('Distance X (km)')
plt.xlabel('Ray parameter (km/s)')
plt.xlim([p1,p2])
plt.savefig('ex4.8.2.png')

plt.figure(3)
result_df['Taup'] = result_df['T'] - result_df['p']*result_df['X']
result_df.plot(x='p', y='Taup', legend=False)
plt.title('Tau(p)')
plt.ylabel('Tau(p) (s)')
plt.xlabel('Ray parameter (km/s)')
plt.xlim([p1,p2])
plt.savefig('ex4.8.3.png')

plt.figure(4)
v_model.h = v_model.h * (-1)
v_model.plot(x='vp', y='h', legend=False)
plt.ylabel('Depth (km)')
plt.xlabel('Velocity (km/s)')
plt.xlim([4,9])
plt.ylim([-10,0])
plt.savefig('ex4.8.4.png')

#plt.show()

LAYERXT subroutine written in python:

from math import sqrt, log


def layerxt(p,h,utop,ubot):
    ''' LAYERXT calculates dx and dt for ray in layer with linear velocity gradient
 
        Inputs:   p     =  horizontal slowness
             h     =  layer thickness
             utop  =  slowness at top of layer
             ubot  =  slowness at bottom of layer
        Returns:  dx    =  range offset
             dt    =  travel time
             irtr  =  return code
                   = -1,  zero thickness layer
                   =  0,  ray turned above layer
                   =  1,  ray passed through layer
                   =  2,  ray turned within layer, 1 segment counted in dx,dt'''
# ray turned above layer
    if p >= utop:
        dx = 0
        dt = 0
        irtr = 0
        return dx,dt,irtr

#Zero thickness layer
    elif h == 0:
        dx = 0
        dt = 0
        irtr = -1
        return dx,dt,irtr

#Calculate some parameters
    u1 = utop
    u2 = ubot
    v1 = 1.0/u1
    v2 = 1.0/u2
#Slope of velocity gradient
    b = (v2 - v1)/h
    eta1 = sqrt(u1**2 - p**2)

#Constant velocity layer
    if b == 0:
        dx = h*p/eta1
        dt = h*u1**2/eta1
        irtr = 1
        return dx,dt,irtr

    x1 = eta1/(u1*b*p)
    tau1=(log((u1+eta1)/p)-eta1/u1)/b

#Ray turned within layer, no contribution to integral from bottom point
    if p >= ubot:
        dx = x1
        dtau = tau1
        dt = dtau + p*dx
        irtr = 2    
        return dx,dt,irtr

        irtr=1
    eta2=sqrt(u2**2-p**2)
    x2=eta2/(u2*b*p)
    tau2=(log((u2+eta2)/p)-eta2/u2)/b

    dx=x1-x2
    dtau=tau1-tau2

    dt=dtau+p*dx
    return dx,dt,irtr

def flat(zsph,vsph):
    ''' Calculate the flatten transformation from a spherical Earth.
        zf, vf = flat(zsph,vsph)'''
    
# Radius of the Earth
    a = 6371.0

    rsph = a - zsph
    zf = -a*log(rsph/float(a))
    vf = (a/float(rsph))*vsph
    return zf, vf

Input velocity model:

h,vp,vs,den
0.0,4.5,2.4,2
1.5,6.8,3.75,2.8
6.0,7.0,3.5,2.9
6.5,8.0,4.6,3.1
10.0,8.1,4.7,3.1

The codes can be downloaded here: main program, python LAYERXT subroutine, velocity model.

You need to install numpy, pandas and matplotlib package to run this. Normally it can be installed in the terminal by (presume python has been installed):

pip install numpy pandas matplotlib

Nguyen Cong Nghia – IESAS


Modeling a wave on a string using finite differences

Based on problem 3.7 chapter 3 of Introduction to Seismology (Shearer)

(COMPUTER) In the case of plane-wave propagation in the x direction within a uniform medium, the homogeneous momentum equation (3.9) for shear waves can be expressed as

screenshot-from-2016-12-14-15-42-21

,where u is the displacement. Write a computer program that uses finite differences to solve this equation for a bar 100 km in length, assuming β = 4 km/s. Use dx = 1 km for the length spacing and dt = 0.1 s for the time spacing. Assume a source-time function  at u (50 km) of the form:

screenshot-from-2016-12-14-15-42-16

Apply a stress-free boundary condition at u(0 km) and a fixed boundary condition at u (100 km).  Approximate the second derivatives using the finite difference scheme:

screenshot-from-2016-12-14-15-42-25

Plot u(x) at 4 s intervals from 1 to 33 s. Verify that the pulses travel at velocities of 4 km/s. What happens to the reflected pulse at each endpoint? What happens when the pulses cross?

Solutions can be downloaded here.

!**********************************************************************
!* *
!* 1-D Plane wave propagation with fixed and free boundaries * 
!* *
!**********************************************************************

!----initialzie t, dx, dt, tlen, beta, and u1, u2, u3 arrays----c

implicit none
 integer:: i, counter, nx, nx1
 integer:: it, ntmax
 real(8):: t, dt, dt2, dx, dx2, beta, beta2, tlen, tmax, rhs
 real*8, allocatable:: u1(:), u2(:), u3(:)
 character(10):: data
 character(4):: nf
!----parameters ----c
! dt must be less than (dx/beta) for numerical stability

nx = 100 ! number of grid
 dt = 0.10d0 ! time interval
 dx = 1.0d0 ! grid interval
 beta = 4.0d0 ! wave velocity
 tlen = 5.0d0 ! time length of wave source
 ntmax = 1000 ! maximum time step (finish at it = ntmax, or)
 tmax = 33.0d0 ! maximum calculation time (finish at t< tmax)

!---- allocate dimension variables ----c

nx1 = nx + 1
 allocate (u1(nx1), u2(nx1), u3(nx1))

!---- initialize t, counter, u1, u2, u3 ----c

t = 0.0d0
 counter = 1
 
 do i = 1, nx1
 u1(i) = 0.0d0
 u2(i) = 0.0d0
 u3(i) = 0.0d0
 end do

!---- calculate c^2, dt^2, dx^2 ----c
 beta2 = beta**2
 dt2 = dt**2
 dx2 = dx**2

! ============= Time marching loop ===========
 
 do it = 1, ntmax

t = t + dt

!---- calculate u3(i) ----c

do i= 2, nx
 rhs=beta2*2*(u2(i+1)-2.0d0*u2(i)+u2(i-1))/dx2
 u3(i)=dt2*rhs+2.0d0*u2(i)-u1(i)
 end do

!---- free boundary (du/dx=0) ----c
 u3(1)=u3(2)
!---- fixed boundary (u=0) ----c
 u3(nx1)=0.0d0
!---- source time function c----c

if (t.le.tlen) then
 u3(51) = sin(3.1415927*t/tlen)**2
 end if

!---- change new and old variables ----c

do i=1,nx1
 u1(i) = u2(i)
 u2(i) = u3(i)
 end do
!---- make data file ----c
 write(nf,'(i3.3)') counter
 data = "data"//nf

open(7,file=data,status='replace')
 do i=1, nx1
 write(7,*) i, u2(i)
 end do
!---- output u2 at desired intervals, stop when t is big enough

write(6,'(a5,1x,i3,1x,f6.3)') 'loop', counter, t
 
 if (t.gt.tmax) exit

counter = counter + 1

end do

stop
 end

The following is used to plot the results:

#!/usr/bin/bash
gnuplot << eof
set term gif animate
set output "animate.gif"
n=9 #n frames
set xrange [0:102]
set yrange [-2:2]
i=0
list = system('ls data*')
do for [file in list] {
 plot file w lines lt 1 lw 1.5 t sprintf("t=%i sec",i/10)
 i = i + 1
}
set output
eof

animate

Nguyen Cong Nghia – IESAS