Hosting a website on the Heroku server

In the earlier post, we’ve seen how to run a python app on the Heroku server. It is even easier to host a webpage on the Heroku server. Most of the steps are similar. Here, I run the app containing HTML, CSS and javascript codes only.

Steps involved

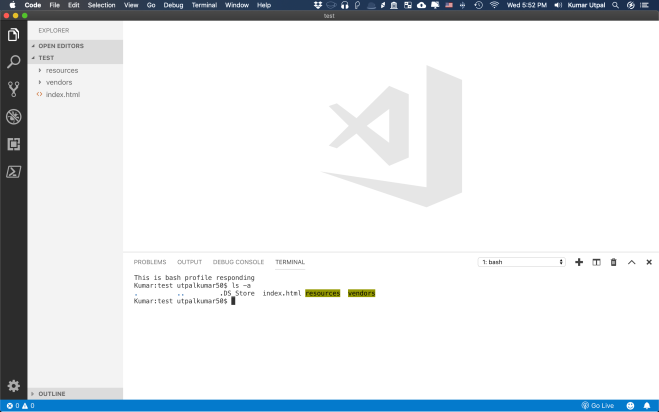
First, navigate to the directory containing the index.html file and execute the following codes (with desired modifications) in the terminal.

Screen Shot 2019-05-08 at 5.52.57 PM.png

Initiate an empty git repo

git init

Create the composer.json and index.php files.

touch composer.json
echo "{}" >composer.json
touch index.php
echo "<?php include_once("index.html"); ?>" >index.php

Now, create a Heroku app and check it’s availability.

heroku create omni-food-app

Add all the files in the current directory to git and commit

git add .
git commit -m 'Initial app to omni-app'

Screen Shot 2019-05-08 at 6.27.18 PM.png
. . .

Next, we deploy the app to the Heroku server

git push heroku master

Screen Shot 2019-05-08 at 6.27.42 PM.png
. . .
Screen Shot 2019-05-08 at 6.27.57 PM.png

Now, follow the link and your webpage is running on the Heroku server.

Screen Shot 2019-05-08 at 6.32.40 PM.png

Time Series Analysis: Filtering or Smoothing the Data

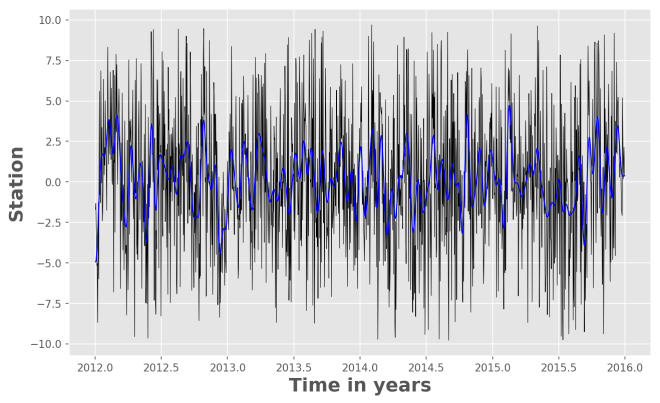
In this post, we will see how we can use Python to low pass filter the 10 year long daily fluctuations of GPS time series. We need to use the “Scipy” package of Python.

The only important thing to keep in mind is the understanding of Nyquist frequency. The Nyquist or folding frequency half of the sampling rate of the discrete signal. To understand the concept of Nyquist frequency and aliasing, the reader is advised to visit this post. For filtering the time-series, we use the fraction of Nyquist frequency (cut-off frequency).

Following is the code and line by line explanation for performing the filtering in few steps:

import numpy as np #importing numpy module for efficiently executing numerical operations
import matplotlib.pyplot as plt #importing the pyplot from the matplotlib library
from scipy import signal

from matplotlib import rcParams
rcParams['figure.figsize'] = (10.0, 6.0) #predefine the size of the figure window
rcParams.update({'font.size': 14}) # setting the default fontsize for the figure
rcParams['axes.labelweight'] = 'bold' #Bold font style for axes labels
from matplotlib import style
style.use('ggplot') #I personally like to use "ggplot" style of graph for my work but it depends on the user's preference whether they wanna use it.

# - - - # We load the data in the mat format but this code will work for any sort of time series.# - - - #
dN=np.array(data['dN'])
dE=np.array(data['dE'])
dU=np.array(data['dU'])
slat=np.array(data['slat'])[0]
slon=np.array(data['slon'])[0]
tdata=np.array(data['tdata'])[0]
stn_name=np.array(stn_info['stn_name'])[0]
stns=[stn_name[i][0] for i in range(len(stn_name))]

# Visualizing the original and the Filtered Time Series
fig = plt.figure()
ax = fig.add_subplot(1, 1, 1)
indx=np.where( (tdata > 2012) & (tdata < 2016) )
ax.plot(tdata[indx],dU[indx,0][0],'k-',lw=0.5)
## Filtering of the time series
fs=1/24/3600 #1 day in Hz (sampling frequency)

nyquist = fs / 2 # 0.5 times the sampling frequency
cutoff=0.1 # fraction of nyquist frequency, here  it is 5 days
print('cutoff= ',1/cutoff*nyquist*24*3600,' days') #cutoff=  4.999999999999999  days
b, a = signal.butter(5, cutoff, btype='lowpass') #low pass filter


dUfilt = signal.filtfilt(b, a, dU[:,0])
dUfilt=np.array(dUfilt)
dUfilt=dUfilt.transpose()

ax.plot(tdata[indx],dUfilt[indx],'b',linewidth=1)

ax.set_xlabel('Time in years',fontsize=18)
ax.set_ylabel('Stations',fontsize=18)
# ax.set_title('Vertical Component CGPS Data')
plt.savefig('test.png',dpi=150,bbox_inches='tight')

test.png

Plot seismogram (SAC file), events, stations in Python (Part 1)

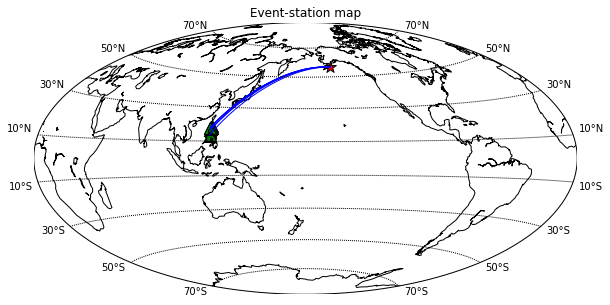
Here is an example of plotting SAC files in Python. The sample SAC files can be downloaded here and the Jupyter notebook can be downloaded here.

First, import some useful packages, including obspy, pandas, numpy and Basemap. By the way, they are all great packages (obspy is amazing for anyone who uses seismic data)

from obspy import read
import pandas as pd
from mpl_toolkits.basemap import Basemap
import matplotlib.pyplot as plt
import numpy as np

#Ignore warnings due to python 2 and 3 conflict
import warnings
warnings.filterwarnings("ignore")

Let’s read the sample Z component using read from obspy

stream = read("2015.0529.0700/*Z.sac")

In here, we use the header from SAC file using tr.stats.sac.(SAC_header)

plt.figure(figsize=(10,5))
# setup mercator map projection.
m = Basemap(lon_0=180,projection='hammer')
evlat = stream[0].stats.sac.evla; evlon = stream[0].stats.sac.evlo

#Plot the event
xx,yy = m(evlon,evlat)
m.scatter(xx, yy, marker = "*" ,s=150, c="r" , edgecolors = "k", alpha = 1)

for tr in stream:
    stlat = tr.stats.sac.stla; stlon = tr.stats.sac.stlo 
    m.drawgreatcircle(stlon,stlat,evlon,evlat,linewidth=1,color='b')
    xx,yy = m(stlon,stlat)
    m.scatter(xx, yy, marker = "^" ,s=150, c="g" , edgecolors = "k", alpha = 1)
    
m.drawcoastlines()
#m.fillcontinents()
m.drawparallels(np.arange(-90,90,20),labels=[1,1,0,1])
plt.title("Event-station map")
plt.show()
fig1

I used a simple trick to plot the seismogram with distance by make the y:
y = data + dist*weight_factor
with data is the amplitude of seismic trace, dist: distance in km (SAC header) and weight_factor = 0.01

The red line indicate the predicted P arrival time that I have calculated and store in SAC header t3

plt.figure(figsize=(10,5))
for tr in stream:
    tr.normalize()
    dist = tr.stats.sac.dist
    plt.plot(tr.times(),tr.data+dist*0.01,c="k",linewidth=0.5)
    plt.scatter(tr.stats.sac.t3,dist*0.01,marker="|",color="r")
plt.ylabel("x100 km")    
plt.ylim(84,77)
plt.xlim(650,800)
plt.show()
fig2.png
Plot the same seismogram but using filled colors (which is more suitable to plot other kind of seismic traces)
plt.figure(figsize=(10,5))
for tr in stream:
    tr.normalize()
    dist = tr.stats.sac.dist*0.01
    x = tr.times()
    y = tr.data+dist
    plt.fill_between(x,y, dist, y > dist, color='r', alpha = 0.8)
    plt.fill_between(x,y, dist, y < dist, color='b', alpha = 0.8)
plt.ylabel("x100 km")    
plt.ylim(84,77)
plt.xlim(650,800)
plt.show()
fig3.png
Nguyen Cong Nghia
IESAS

Plotting the geospatial data clipped by coastlines in Python

In geosciences, we most frequently have to make geospatial plots, but the available data is unevenly distributed and irregular (Figure 1). We like to show the data, in general, for the whole region and one way of performing, so it to do the geospatial interpolation of the data. Geospatial interpolation means merely that we obtain the interpolated values of the data at regular grid points, both longitudinally and latitudinally. After obtaining these values, if we plot the data then the grid points is most likely to extend out of the coastline constrain of our study. We wish to plot the data inside the coastline borders of the area, which is our area of study. We can do that by just removing all the grid points outside the perimeter. One way to clip the data outside the coastline path is to manually remove the grid points outside the region, but this method is quite tedious. We, programmers, love being lazy and that helps us to seek better ways.

orig_data1
Figure 1: Scatter plot of the data. The size and color of the circles represent the data values.

In this post, we aim to do (1) the interpolation of these data values using the ordinary kriging method and (2) plot the output within the coastline border of Taiwan.

For implementing the ordinary kriging interpolation, we will use the “pykrige” kriging toolkit available for Python. The package can be easily installed using the “pip” or “conda” package manager for Python.

We start by importing all the necessary modules.

import numpy as np
import pandas as pd
import glob
from pykrige.ok import OrdinaryKriging
from pykrige.kriging_tools import write_asc_grid
import pykrige.kriging_tools as kt
import matplotlib.pyplot as plt
from mpl_toolkits.basemap import Basemap
from matplotlib.colors import LinearSegmentedColormap
from matplotlib.patches import Path, PathPatch
Screen Shot 2018-08-18 at 7.25.32 PM.png
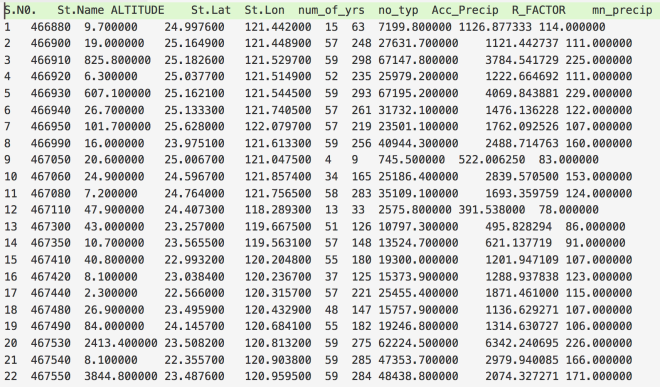
Figure 2: Data in the tabular format

The first step for interpolation is to read the available data. Our data is of the format shown in Figure 2. Let’s say we want to interpolate for the “R_FACTOR”. We first read this data file. We can easily do that using the “pandas” in Python.

datafile='datafilename.txt'
df=pd.read_csv(datafile,delimiter='\s+')

Now, we have read the whole tabular data, but we need only the “R_FACTOR”, “St.Lat”, and “St.Lon” columns.

lons=np.array(df['St.Lon']) 
lats=np.array(df['St.Lat']) 
data=np.array(df[data])

Now, we have our required data available in the three variables. We can, now, define the grid points where we seek the interpolated values.

grid_lon = np.arange(lons.min()-0.05, lons.max()+0.1, grid_space) 
grid_lat = np.arange(lats.min()-0.05, lats.max()+0.1, grid_space)

The minimum and maximum of the longitude and latitude are chosen based on the data.

We use the “ordinary kriging” function of “pykrige” package to interpolate our data at the defined grid points. For more details, the user can refer to the manual of the “pykrige” package.

OK = OrdinaryKriging(lons, lats, data, variogram_model='gaussian', verbose=True, enable_plotting=False,nlags=20)
z1, ss1 = OK.execute('grid', grid_lon, grid_lat)

“z1” is the interpolated values of “R_FACTOR” at the grid_lon and grid_lat values.

Now, we wish to plot the interpolated values. We will use the “basemap” module to plot the geographic data.

xintrp, yintrp = np.meshgrid(grid_lon, grid_lat)
fig, ax = plt.subplots(figsize=(10,10))
m = Basemap(llcrnrlon=lons.min()-0.1,llcrnrlat=lats.min()-0.1,urcrnrlon=lons.max()+0.1,urcrnrlat=lats.max()+0.1, projection='merc', resolution='h',area_thresh=1000.,ax=ax)

We, first, made the 2D meshgrid using the grid points and then call the basemap object “m” with the Mercator projection. The constraints of the basemap object can be manually defined instead of the minimum and maximum of the latitude and longitude values as used.

m.drawcoastlines() #draw coastlines on the map
x,y=m(xintrp, yintrp) # convert the coordinates into the map scales
ln,lt=m(lons,lats)
cs=ax.contourf(x, y, z1, np.linspace(0, 4500, ncols),extend='both',cmap='jet') #plot the data on the map.
cbar=m.colorbar(cs,location='right',pad="7%") #plot the colorbar on the map
# draw parallels.
parallels = np.arange(21.5,26.0,0.5)
m.drawparallels(parallels,labels=[1,0,0,0],fontsize=14, linewidth=0.0) #Draw the latitude labels on the map

# draw meridians
meridians = np.arange(119.5,122.5,0.5)
m.drawmeridians(meridians,labels=[0,0,0,1],fontsize=14, linewidth=0.0)
R_FACTOR_WITH_ST_ALTITUDE-R_Factor
Figure 3: Interpolated values without masking the outer region.

This will give us the plot of the interpolated values (Figure 3). Here, we do not seek the plot outside the coastline boundary of Taiwan. We wish to mask the data outside the boundary.

##getting the limits of the map:
x0,x1 = ax.get_xlim()
y0,y1 = ax.get_ylim()
map_edges = np.array([[x0,y0],[x1,y0],[x1,y1],[x0,y1]])
##getting all polygons used to draw the coastlines of the map
polys = [p.boundary for p in m.landpolygons]

##combining with map edges
polys = [map_edges]+polys[:]
##creating a PathPatch
codes = [
[Path.MOVETO]+[Path.LINETOfor p in p[1:]]
for p in polys
]

polys_lin = [v for p in polys for v in p]
codes_lin = [c for cs in codes for c in cs]

path = Path(polys_lin, codes_lin)
patch = PathPatch(path,facecolor='white', lw=0)

Here, the ‘facecolor’ of the ‘pathpatch’ defines the color of the masking. We kept is ‘white,’ but the user can define any color they like.

##masking the data outside the inland of taiwan
ax.add_patch(patch)
R_FACTOR_WITH_ST_ALTITUDE-R_Factor
Figure 4: Interpolated values with the masking of the outer region.


Writing NetCDF4 Data using Python

For how to read a netCDF data, please refer to the previous post. Also, check the package and tools required for writing the netCDF data, check the page for reading the netCDF data.

Importing relevant libraries

import netCDF4 
import numpy as np

Screen Shot 2017-10-03 at 2.20.50 PM.png

Let us create a new empty netCDF file named “new.nc” in the “../../data” directory and open it for writing.

ncfile = netCDF4.Dataset('../../data/new.nc',mode='w',format='NETCDF4_CLASSIC') 
print(ncfile)

Screen Shot 2017-10-03 at 2.30.59 PM.png

Notice here that we have set the mode to be “w”, which means write mode. We can also open the data in append mode (“a”). It is safe to check whether the netCDF file has closed, using the try and except statement.

Creating Dimensions

We can now fill the netCDF files opened with the dimensions, variables, and attributes. First of all, let’s create the dimension.

lat_dim = ncfile.createDimension('lat', 73) # latitude axis
lon_dim = ncfile.createDimension('lon', 144) # longitude axis
time_dim = ncfile.createDimension('time', None) # unlimited axis (can be appended to).
for dim in ncfile.dimensions.items():
 print(dim)

Screen Shot 2017-10-03 at 2.35.59 PM.png

Every dimension has a name and length. If we set the dimension length to be 0 or None, then it takes it as of unlimited size and can grow. Since we are following the netCDF classic format, only one dimension can be unlimited. To make more than one dimension to be unlimited follow the other format. Here, we will constrain to the classic format only as it is the simplest one.

Creating attributes

One of the nice features of netCDF data format is that we can also store the meta-data information along with the data. This information can be stored as attributes.

ncfile.title='My model data'
print(ncfile.title)

Screen Shot 2017-10-03 at 2.43.38 PM.png

ncfile.subtitle="My model data subtitle"
ncfile.anything="write anything"
print(ncfile.subtitle)
print(ncfile)
print(ncfile.anything)

Screen Shot 2017-10-03 at 2.45.55 PM.png

We can add as many attributes as we like.

Creating Variables

Now, let us add some variables to store some data in them. A variable has a name, a type, a shape and some data values. The shape of the variable can be stated using the tuple of the dimension names. The variable should also contain some attributes such as units to describe the data.

lat = ncfile.createVariable('lat', np.float32, ('lat',))
lat.units = 'degrees_north'
lat.long_name = 'latitude'
lon = ncfile.createVariable('lon', np.float32, ('lon',))
lon.units = 'degrees_east'
lon.long_name = 'longitude'
time = ncfile.createVariable('time', np.float64, ('time',))
time.units = 'hours since 1800-01-01'
time.long_name = 'time'
temp = ncfile.createVariable('temp',np.float64,('time','lat','lon')) # note: unlimited dimension is leftmost
temp.units = 'K' # degrees Kelvin
temp.standard_name = 'air_temperature' # this is a CF standard name
print(temp) 

Screen Shot 2017-10-03 at 2.51.29 PM.png

Here, we create the variable using the createVariable method. This method takes 3 arguments: a variable name (string type), data types, a tuple containing the dimension. We have also added some attributes such as for the variable lat, we added the attribute of units and long_name. Also, notice the units of the time variable.

We also have defined the 3-dimensional variable “temp” which is dependent on the other variables time, lat and lon.

In addition to the custom attributes, the netCDF provides some pre-defined attributes as well.

print("-- Some pre-defined attributes for variable temp:")
print("temp.dimensions:", temp.dimensions)
print("temp.shape:", temp.shape)
print("temp.dtype:", temp.dtype)
print("temp.ndim:", temp.ndim) 

Screen Shot 2017-10-03 at 2.57.36 PM

Since no data has been added, the length of the time dimension is 0.

Writing Data

nlats = len(lat_dim); nlons = len(lon_dim); ntimes = 3
lat[:] = -90. + (180./nlats)*np.arange(nlats) # south pole to north pole
lon[:] = (180./nlats)*np.arange(nlons) # Greenwich meridian eastward
data_arr = np.random.uniform(low=280,high=330,size=(ntimes,nlats,nlons))
temp[:,:,:] = data_arr # Appends data along unlimited dimension
print("-- Wrote data, temp.shape is now ", temp.shape)
print("-- Min/Max values:", temp[:,:,:].min(), temp[:,:,:].max())

Screen Shot 2017-10-03 at 3.02.52 PM.png

The length of the lat and lon variable will be equal to its dimension. Since the length of the time variable is unlimited and is subject to grow, we can give it any size. We can treat netCDF array as a numpy array and add data to it. The above statement writes all the data at once, but we can do it iteratively as well.

Now, let’s add another time slice.

data_slice = np.random.uniform(low=280,high=330,size=(nlats,nlons))
temp[3,:,:] = data_slice 
print("-- Wrote more data, temp.shape is now ", temp.shape) 

Screen Shot 2017-10-03 at 3.10.20 PM.png

Note, that we haven’t added any data to the time variable yet.

print(time)
times_arr = time[:]
print(type(times_arr),times_arr) 

Screen Shot 2017-10-03 at 3.12.50 PM.png

The dashes indicate that there is no data available. Also, notice the 4 dashes corresponding to the four levels in of the time stacks.

Now, let us write some data to the time variable using the datetime module of Python and the date2num function of netCDF4.

import datetime as dt
from netCDF4 import date2num,num2date
dates = [dt.datetime(2014,10,1,0),dt.datetime(2014,10,2,0),dt.datetime(2014,10,3,0),dt.datetime(2014,10,4,0)]
print(dates)

Screen Shot 2017-10-03 at 3.17.16 PM.png

times = date2num(dates, time.units)
print(times, time.units) # numeric values

Screen Shot 2017-10-03 at 3.18.53 PM.png

Now, it’s important to close the netCDF file which has been opened previously. This flushes buffers to make sure all the data gets written. It also releases the memory resources used by the netCDF file.

# first print the Dataset object to see what we've got
print(ncfile)
# close the Dataset.
ncfile.close(); print('Dataset is closed!')

Screen Shot 2017-10-03 at 3.23.38 PM.png


Reading NetCDF4 Data in Python

In Earth Sciences, we often deal with multidimensional data structures such as climate data, GPS data. It ‘s hard to save such data in text files as it would take a lot of memory as well as it is not fast to read, write and process it. One of the best tools to deal with such data is netCDF4. It stores the data in the HDF5 format (Hierarchical Data Format). The HDF5 is designed to store a large amount of data. NetCDF is the project hosted by Unidata Program at the University Corporation for Atmospheric Research (UCAR).

Here, we learn how to read and write netCDF4 data. We follow the workshop by Unidata. You can check out the website of Unidata.

Requirements:

Python3:

You can install Python3 via the Anaconda platform. I would recommend Miniconda over Anaconda because it is more light and installs only fundamental requirements for Python.

NetCDF4 Package:

conda install -c conda-forge netcdf4

Reading NetCDF data:

Now, we are good to go. Let’s see how we can read a netCDF data. The netCDF data has the extension of “.nc”


Importing NetCDF and Numpy ( a Python library that supports large multi-dimensional arrays or matrices):

import netCDF4
import numpy as np

Now, let us open a NetCDF Dataset object:

f = netCDF4.Dataset('../../data/rtofs_glo_3dz_f006_6hrly_reg3.nc')

Screen Shot 2017-10-03 at 12.21.35 PM.png

Here, we have read a NetCDF file “rtofs_glo_3dz_f006_6hrly_reg3.nc”. When we print the object “f”, then we can notice that it has a file format of HDF5. It also has other information regarding the title, institution, etc for the data. These are known as metadata.

In the end of the object file print output, we see the dimensions and variable information of the data set. This dataset has 4 dimensions: MT (with size 1), Y (size: 850), X (size: 712), Depth (size: 10). Then we have the variables. The variables are based on the defined dimensions. The variables are outputted with their data type such as float64 MT (dimension: MT).

Some variables are based on only one dimension while others are based on more than one. For example, “temperature” variable relies on four dimensions – MT, Depth, Y, X in the same order.

We can access the information from this object, “f” just like we read a dictionary in Python.

print(f.variables.keys()) # get all variable names

Screen Shot 2017-10-03 at 12.35.04 PM.png

This outputs the names of all the variables in the read netCDF file referenced by “f” object.

We can also individually access each variable:

temp = f.variables['temperature'] # temperature variable
print(temp) 

Screen Shot 2017-10-03 at 12.35.47 PM.png

The “temperature” variable is of the type float32 and has 4 dimensions – MT, Depth, Y, X. We can also get the other information (meta-data) like the coordinates, standard name, units of the variable. Coordinate variables are the 1D variables that have the same name as dimensions. It is helpful in locating the values in time and space. The unit of temperature variable data is “degC”. The current shape gives the information about the shape of this variable. Here, it has the shape of (1, 10, 850, 712) for each dimension.

We can also check the dimension size of this variable individually:

for d in f.dimensions.items():
print(d)

Screen Shot 2017-10-03 at 12.44.11 PM.png

The first dimension “MT” has the size of 1, but it is of unlimited type. This means that the size of this dimension can be increased indefinitely. The size of the other dimensions is fixed.

For just finding the dimensions supporting the “temperature” variable:

temp.dimensions

Screen Shot 2017-10-03 at 12.51.38 PM.png

temp.shape

Screen Shot 2017-10-03 at 12.54.34 PM.png

Similarly, we can also inspect the variables associated with each dimension:

mt = f.variables['MT']
depth = f.variables['Depth']
x,y = f.variables['X'], f.variables['Y']
print(mt)
print(x)
print(y)
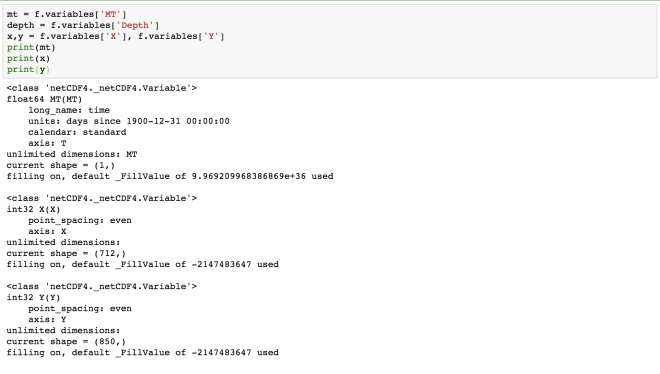
Screen Shot 2017-10-03 at 12.58.09 PM.png

Here, we obtain the information about each of the four dimensions. The “MT” dimension, which is also a variable has a long name of “time” and units of “days since 1900-12-31 00:00:00”.  The four dimensions denote the four axes, namely- MT: T, Depth: Z, X:X, Y: Y.

Now, how do we access the data from the NetCDF variable we have just read. The NetCDF variables behave similarly to NumPy arrays. NetCDF variables can also be sliced and masked.

Let us first read the data of the variable “MT”:

time = mt[:] 
print(time)

Screen Shot 2017-10-03 at 1.07.22 PM.png

Similarly, for the depth array:

dpth = depth[:]
print(depth.shape)
print(depth.dimensions)
print(dpth)

Screen Shot 2017-10-03 at 1.08.32 PM.png

We can also apply conditionals on the slicing of the netCDF variable:

xx,yy = x[:],y[:]
print('shape of temp variable: %s' % repr(temp.shape))
tempslice = temp[0, dpth > 400, yy > yy.max()/2, xx > xx.max()/2]
print('shape of temp slice: %s' % repr(tempslice.shape))

Screen Shot 2017-10-03 at 1.10.57 PM.png

Now, let us address one question based on the given dataset. “What is the sea surface temperature and salinity at 50N and 140W?

Our dataset has the variables temperature and salinity. The “temperature” variable represents the sea surface temperature (see the long name). Now, we have to access the sea-surface temperature and salinity at a given geographical coordinates. We have the variables latitude and longitude as well.

The X and Y variables do not give the geographical coordinates. But we have the variables latitude and longitude as well.

lat, lon = f.variables['Latitude'], f.variables['Longitude']
print(lat)
print(lon)
print(lat[:])

Screen Shot 2017-10-03 at 1.19.13 PM.png

Great! So we can access the latitude and longitude data. Now, we need to find the array index, say iy and ix such that Latitude[iy, ix] is close to 50 and Longitude[iy, ix] is close to -140. We can find out the index by defining a function:

# extract lat/lon values (in degrees) to numpy arrays
latvals = lat[:]; lonvals = lon[:] 

# a function to find the index of the point closest pt
# (in squared distance) to give lat/lon value.
def getclosest_ij(lats,lons,latpt,lonpt):
 # find squared distance of every point on grid
 dist_sq = (lats-latpt)**2 + (lons-lonpt)**2 
 # 1D index of minimum dist_sq element
 minindex_flattened = dist_sq.argmin()
 # Get 2D index for latvals and lonvals arrays from 1D index
 return np.unravel_index(minindex_flattened, lats.shape)

iy_min, ix_min = getclosest_ij(latvals, lonvals, 50., -140)
print(iy_min)
print(ix_min)

Screen Shot 2017-10-03 at 1.24.01 PM.png

So, now we have all the information required to answer the question.

sal = f.variables['salinity']
# Read values out of the netCDF file for temperature and salinity
print('%7.4f %s' % (temp[0,0,iy_min,ix_min], temp.units))
print('%7.4f %s' % (sal[0,0,iy_min,ix_min], sal.units))

Screen Shot 2017-10-03 at 1.27.04 PM.png

Accessing the Remote Data via openDAP:

We can access the remote data seamlessly using the netcdf4-python API. We can access via the DAP protocol and DAP servers, such as TDS.

For using this functionality, we require the additional package “siphon”:

conda install -c unidata siphon 

Now, let us access one catalog data:

from siphon.catalog import get_latest_access_url
URL = get_latest_access_url('http://thredds.ucar.edu/thredds/catalog/grib/NCEP/GFS/Global_0p5deg/catalog.xml',
 'OPENDAP')
gfs = netCDF4.Dataset(URL)

Screen Shot 2017-10-03 at 1.36.59 PM.png

# Look at metadata for a specific variable
# gfs.variables.keys() #will show all available variables.
print("========================")
sfctmp = gfs.variables['Temperature_surface']
# get info about sfctmp
print(sfctmp)
print("==================")
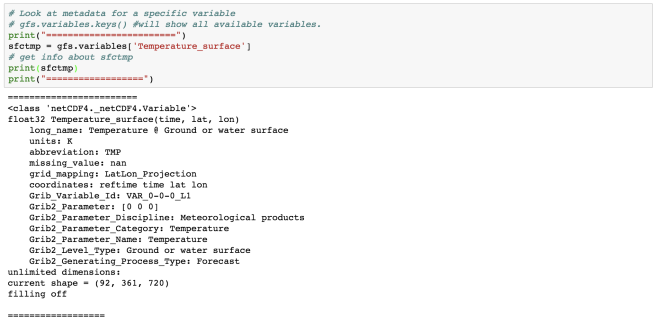
Screen Shot 2017-10-03 at 1.38.19 PM.png

# print coord vars associated with this variable
for dname in sfctmp.dimensions: 
 print(gfs.variables[dname])
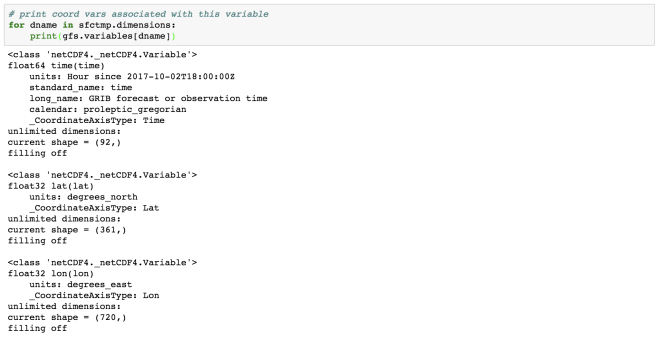
Screen Shot 2017-10-03 at 1.39.42 PM.png

Dealing with the Missing Data

soilmvar = gfs.variables['Volumetric_Soil_Moisture_Content_depth_below_surface_layer']
print(soilmvar)
print("================")
print(soilmvar.missing_value)

Screen Shot 2017-10-03 at 1.42.51 PM.png

# flip the data in latitude so North Hemisphere is up on the plot
soilm = soilmvar[0,0,::-1,:] 
print('shape=%s, type=%s, missing_value=%s' % \
 (soilm.shape, type(soilm), soilmvar.missing_value))

Screen Shot 2017-10-03 at 1.44.02 PM.png

import matplotlib.pyplot as plt
%matplotlib inline
cs = plt.contourf(soilm)

Screen Shot 2017-10-03 at 1.45.33 PM.png

Here, the soil moisture has been illustrated on the land only. The white areas on the plot are the masked values.

Dealing with Dates and Times

The time variables are usually measured relative to a fixed date using a certain calendar. The specified units are like “hours since YY:MM:DD hh:mm:ss”.

from netCDF4 import num2date, date2num, date2index
timedim = sfctmp.dimensions[0] # time dim name
print('name of time dimension = %s' % timedim)

Screen Shot 2017-10-03 at 1.51.34 PM.png

Time is usually the first dimension.

times = gfs.variables[timedim] # time coord var
print('units = %s, values = %s' % (times.units, times[:]))

Screen Shot 2017-10-03 at 1.54.25 PM.png

dates = num2date(times[:], times.units)
print([date.strftime('%Y-%m-%d %H:%M:%S') for date in dates[:10]]) # print only first ten...

Screen Shot 2017-10-03 at 1.55.46 PM.png

We can also get the index associated with the specified date and forecast the data for that date.

import datetime as dt
date = dt.datetime.now() + dt.timedelta(days=3)
print(date)
ntime = date2index(date,times,select='nearest')
print('index = %s, date = %s' % (ntime, dates[ntime]))

Screen Shot 2017-10-03 at 1.57.50 PM.png

This gives the time index for a time nearest to 3 days from today, current time.

Now, we can again make use of the previously defined “getcloset_ij” function to find the index of the latitude and longitude.

lats, lons = gfs.variables['lat'][:], gfs.variables['lon'][:]
# lats, lons are 1-d. Make them 2-d using numpy.meshgrid.
lons, lats = np.meshgrid(lons,lats)
j, i = getclosest_ij(lats,lons,40,-105)
fcst_temp = sfctmp[ntime,j,i]
print('Boulder forecast valid at %s UTC = %5.1f %s' % \
 (dates[ntime],fcst_temp,sfctmp.units))

Screen Shot 2017-10-03 at 2.01.18 PM.png

So, we have the forecast for 2017-10-06 15 hrs. The surface temperature at boulder is 304.2 K.

Simple Multi-file Aggregation

If we have many similar data, then we can aggregate them as one. For example, if we have the many netCDF files representing data for different years, then we can aggregate them as one.

Screen Shot 2017-10-03 at 2.08.20 PM.png

Multi-File Dataset (MFDataset) uses file globbing to patch together all the files into one big Dataset.
Limitations:- It can only aggregate the data along the leftmost dimension of each variable.

  • It can only aggregate the data along the leftmost dimension of each variable.
  • only works with NETCDF3, or NETCDF4_CLASSIC formatted files.
  • kind of slow.
mf = netCDF4.MFDataset('../../data/prmsl*nc')
times = mf.variables['time']
dates = num2date(times[:],times.units)
print('starting date = %s' % dates[0])
print('ending date = %s'% dates[-1])
prmsl = mf.variables['prmsl']
print('times shape = %s' % times.shape)
print('prmsl dimensions = %s, prmsl shape = %s' %\
 (prmsl.dimensions, prmsl.shape))

Screen Shot 2017-10-03 at 2.10.53 PM.png

Finally, we need to close the opened netCDF dataset.

f.close()
gfs.close()

Screen Shot 2017-10-03 at 2.12.18 PM.png

To download the data, click here. Next, we will see how to write a netCDF data.
Generic Mapping Tool (GMT) for Beginners

To download all the scripts, figures and data, click here.

Basemap for Linear Plots:


Bash script to generate above plots is here.

Plotting Maps:

Bash script to generate above plots is here and here.

Writing Text on the Figure:

GMT_figure14

Bash script to generate above plots is here.

Contour Plots:

Bash script to generate above plots is here.

Colored Images and Color-bars:

Bash script to generate above plots is here.

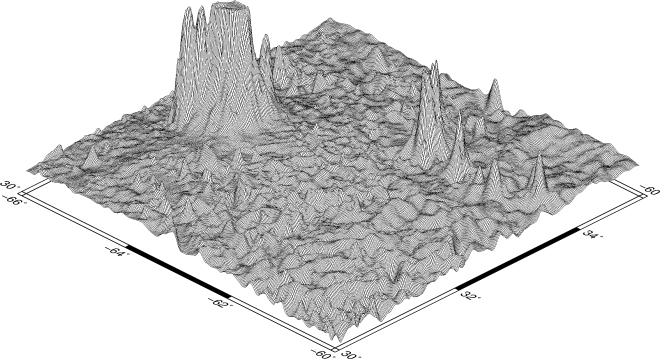
3-D Plots:

GMT_figure24GMT_figure23

Bash script to generate above plots is here.


Earthquake Finder

This program can be used to obtain the earthquake information from various sources. The user can search for any event for given time range, magnitude range, depth range, geographical area. It can also obtain the focal mechanism solutions for the given parameters. It gives the output file (catalog.txt by default) where all the information is stored. It also plots the output (both with the focal mechanism and without it.)
This program makes use of the obspy module of Python and retrieve data from the International Seismological Center (ISC) server

Examples:

to run with default parameters

python3 earthquakeFinder.py

to obtain the earthquake info between today, March 2016 to the current time

python3 earthquakeFinder.py st=2016/3

to obtain the earthquake info between 2016, march, 29 to 2016, september, 22

python3 earthquakeFinder.py st=2016/3/29,et=2016/9/22

to obtain the catalog for magnitudes between 4-9 and with focal mechanism

python3 earthquakeFinder.py mxmag=9,mnmag=4,fm=yes

to obtain catalog for magnitude 4-7, and within radius of 10 (default) and central coordinates 22(lat),121(lon) with focal mechanism

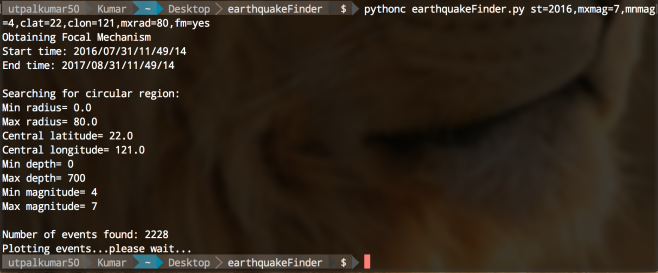
python3 earthquakeFinder.py mxmag=7,mnmag=4,clat=22,clon=121,mxrad=80,fm=yes

focalmechanismcircularsearch

Parameters to change (default values in the braces):

mnla(-90),mxla(90),mnlo(-180),mxlo(180),mndep(0),mxdep(700),mnmag(4),mxmag(10),mnrad(0),mxrad(10),clat(None),clon(None),st(-1 month),et (current time),fm(no)

Output format of the catalog

Without Focal Mechanism -> “YEAR MONTH DAY HOUR MINUTES SECONDS LONGITUDE (in deg) LATITUDE(in deg) DEPTH(in km) MAG_TYPE MAG EVENT_NAME.”

With Focal Mechanism -> “YEAR MONTH DAY HOUR MIN SEC LONGITUDE LATITUDE DEPTH EXP(Nm) M0 MAG Mrr Mtt Mpp Mrt Mtp Mpr Str1 Dip1 Rake1 Str2 Dip2 Rake2.”

Requirements

  1. Python 3: Can be obtained from here.
  2. Extra Modules
    (a) requests: pip install requests
    (b) pandas: pip install pandas
    (c) obspy: pip install obspy
    (d) basemap: It is a great tool for creating maps using python in a simple way. The best way to obtain basemap is via Anaconda/MinicondaFor Linux/Mac users just download the bash installer and inside the download directory, execute the following command: bash Miniconda*.sh

    For Windows user, download the exe file and install it. After the installation of Anaconda/Miniconda, basemap can be obtained by simply executing the command conda install basemap


Click here
to download the programs.


Program for extracting the earthquake informations

Introduction

Often in seismology, we require the information about the earthquake such as location, origin time, depth, magnitude, etc. To obtain this information, users generally, browse the web or if he/she is experienced then just go to the predetermined sites such as global CMT catalog. Even, after reaching the correct website, we need to do some dig up to get the desired information. This program is meant to scrape the global CMT website to obtain the earthquake information.

How to obtain the program

You can download the package from here.

How to use the program

The package you download from the given site consists of two python programs. These programs require pre-installed python-3.

You can obtain python from the following websites:
1. Python software
2. The user can also download the python package anaconda

After installing the python 3, to run the program, type:
python3 EQinfo_extractor.py
Then enter the event recognition parameter such as
1976,3,8,4,39
And enter. It will prompt the event information.

Screen Shot 2017-08-27 at 10.07.05 PM

Using the program as a module

You can also use the package as a python module. For using it as a module, save the program in the current directory or in the computer-discoverable path.
import EQinfo_extractor as eq_ext
eq_ext.eventinfo(1976,3,8,4,39)