Why do we use Git?
Git can record changes to our file over time. We can recall any specific version of the file at any given time. It also allows many people to easily collaborate on a project and have their own version of the project files on their local computer. It is incredibly useful to keep all the histories of the project codes so that if we want to go back the previous version in the future, we don’t need to rewrite it but we can just switch back to the past version directly.
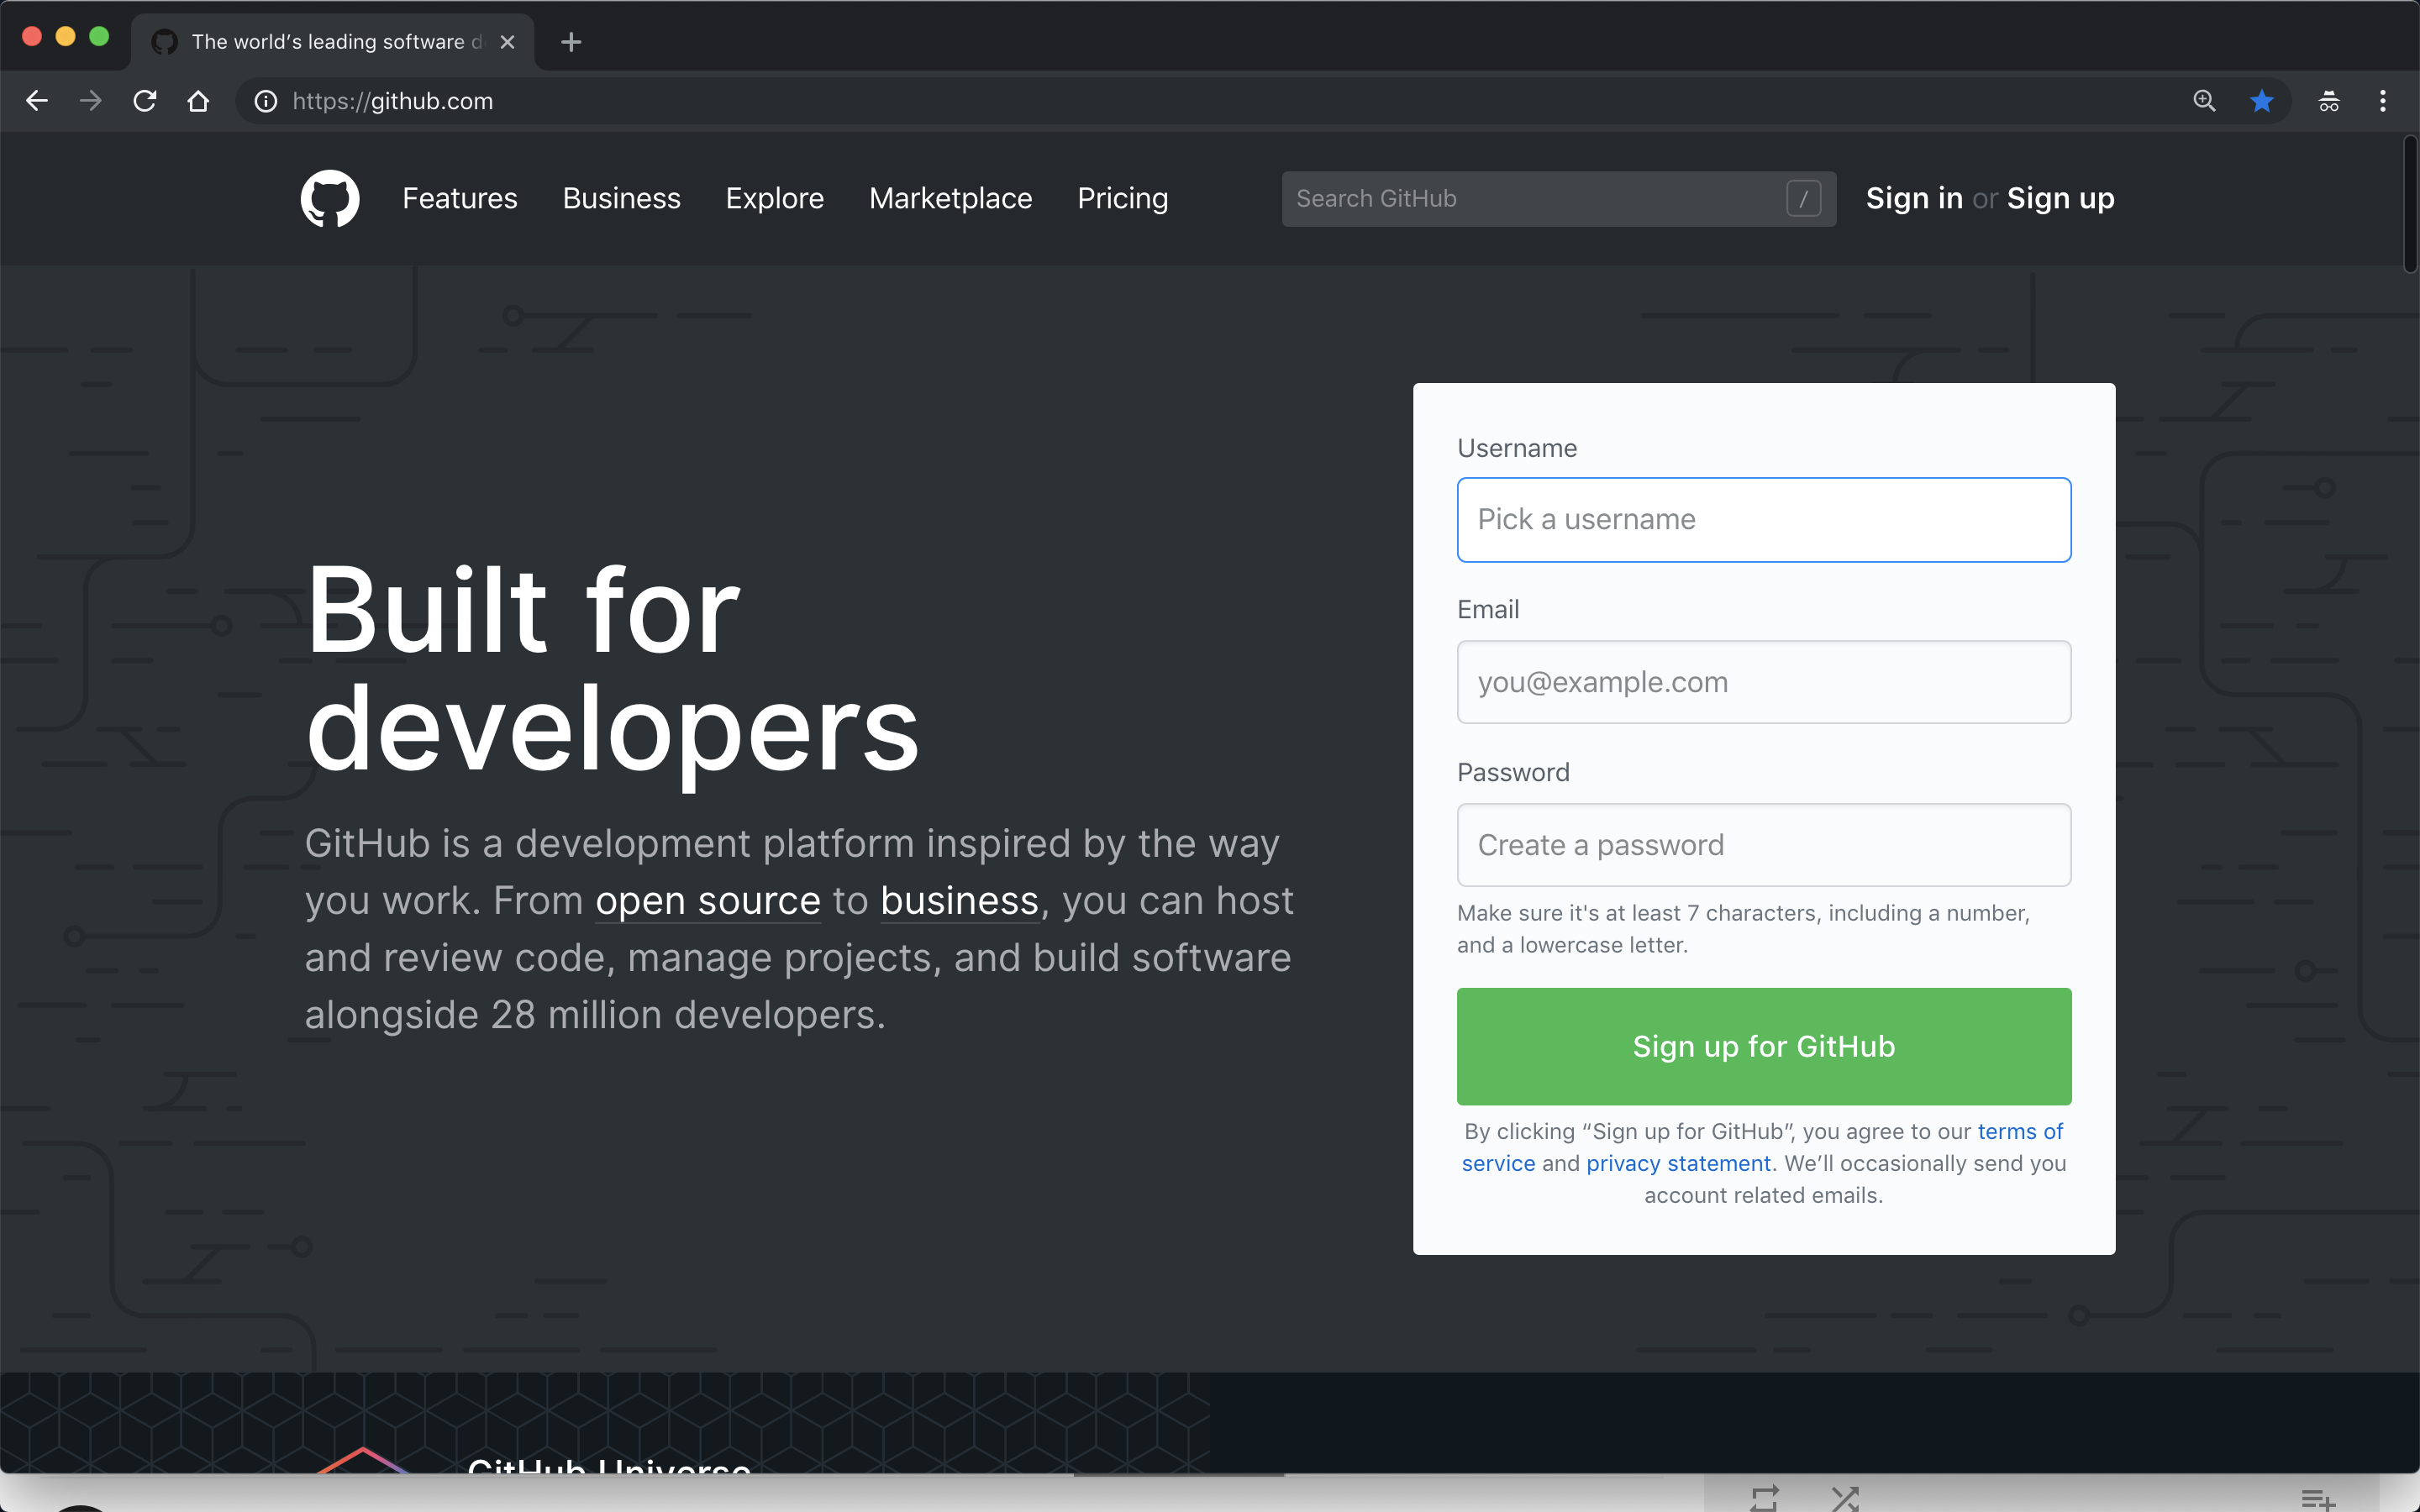
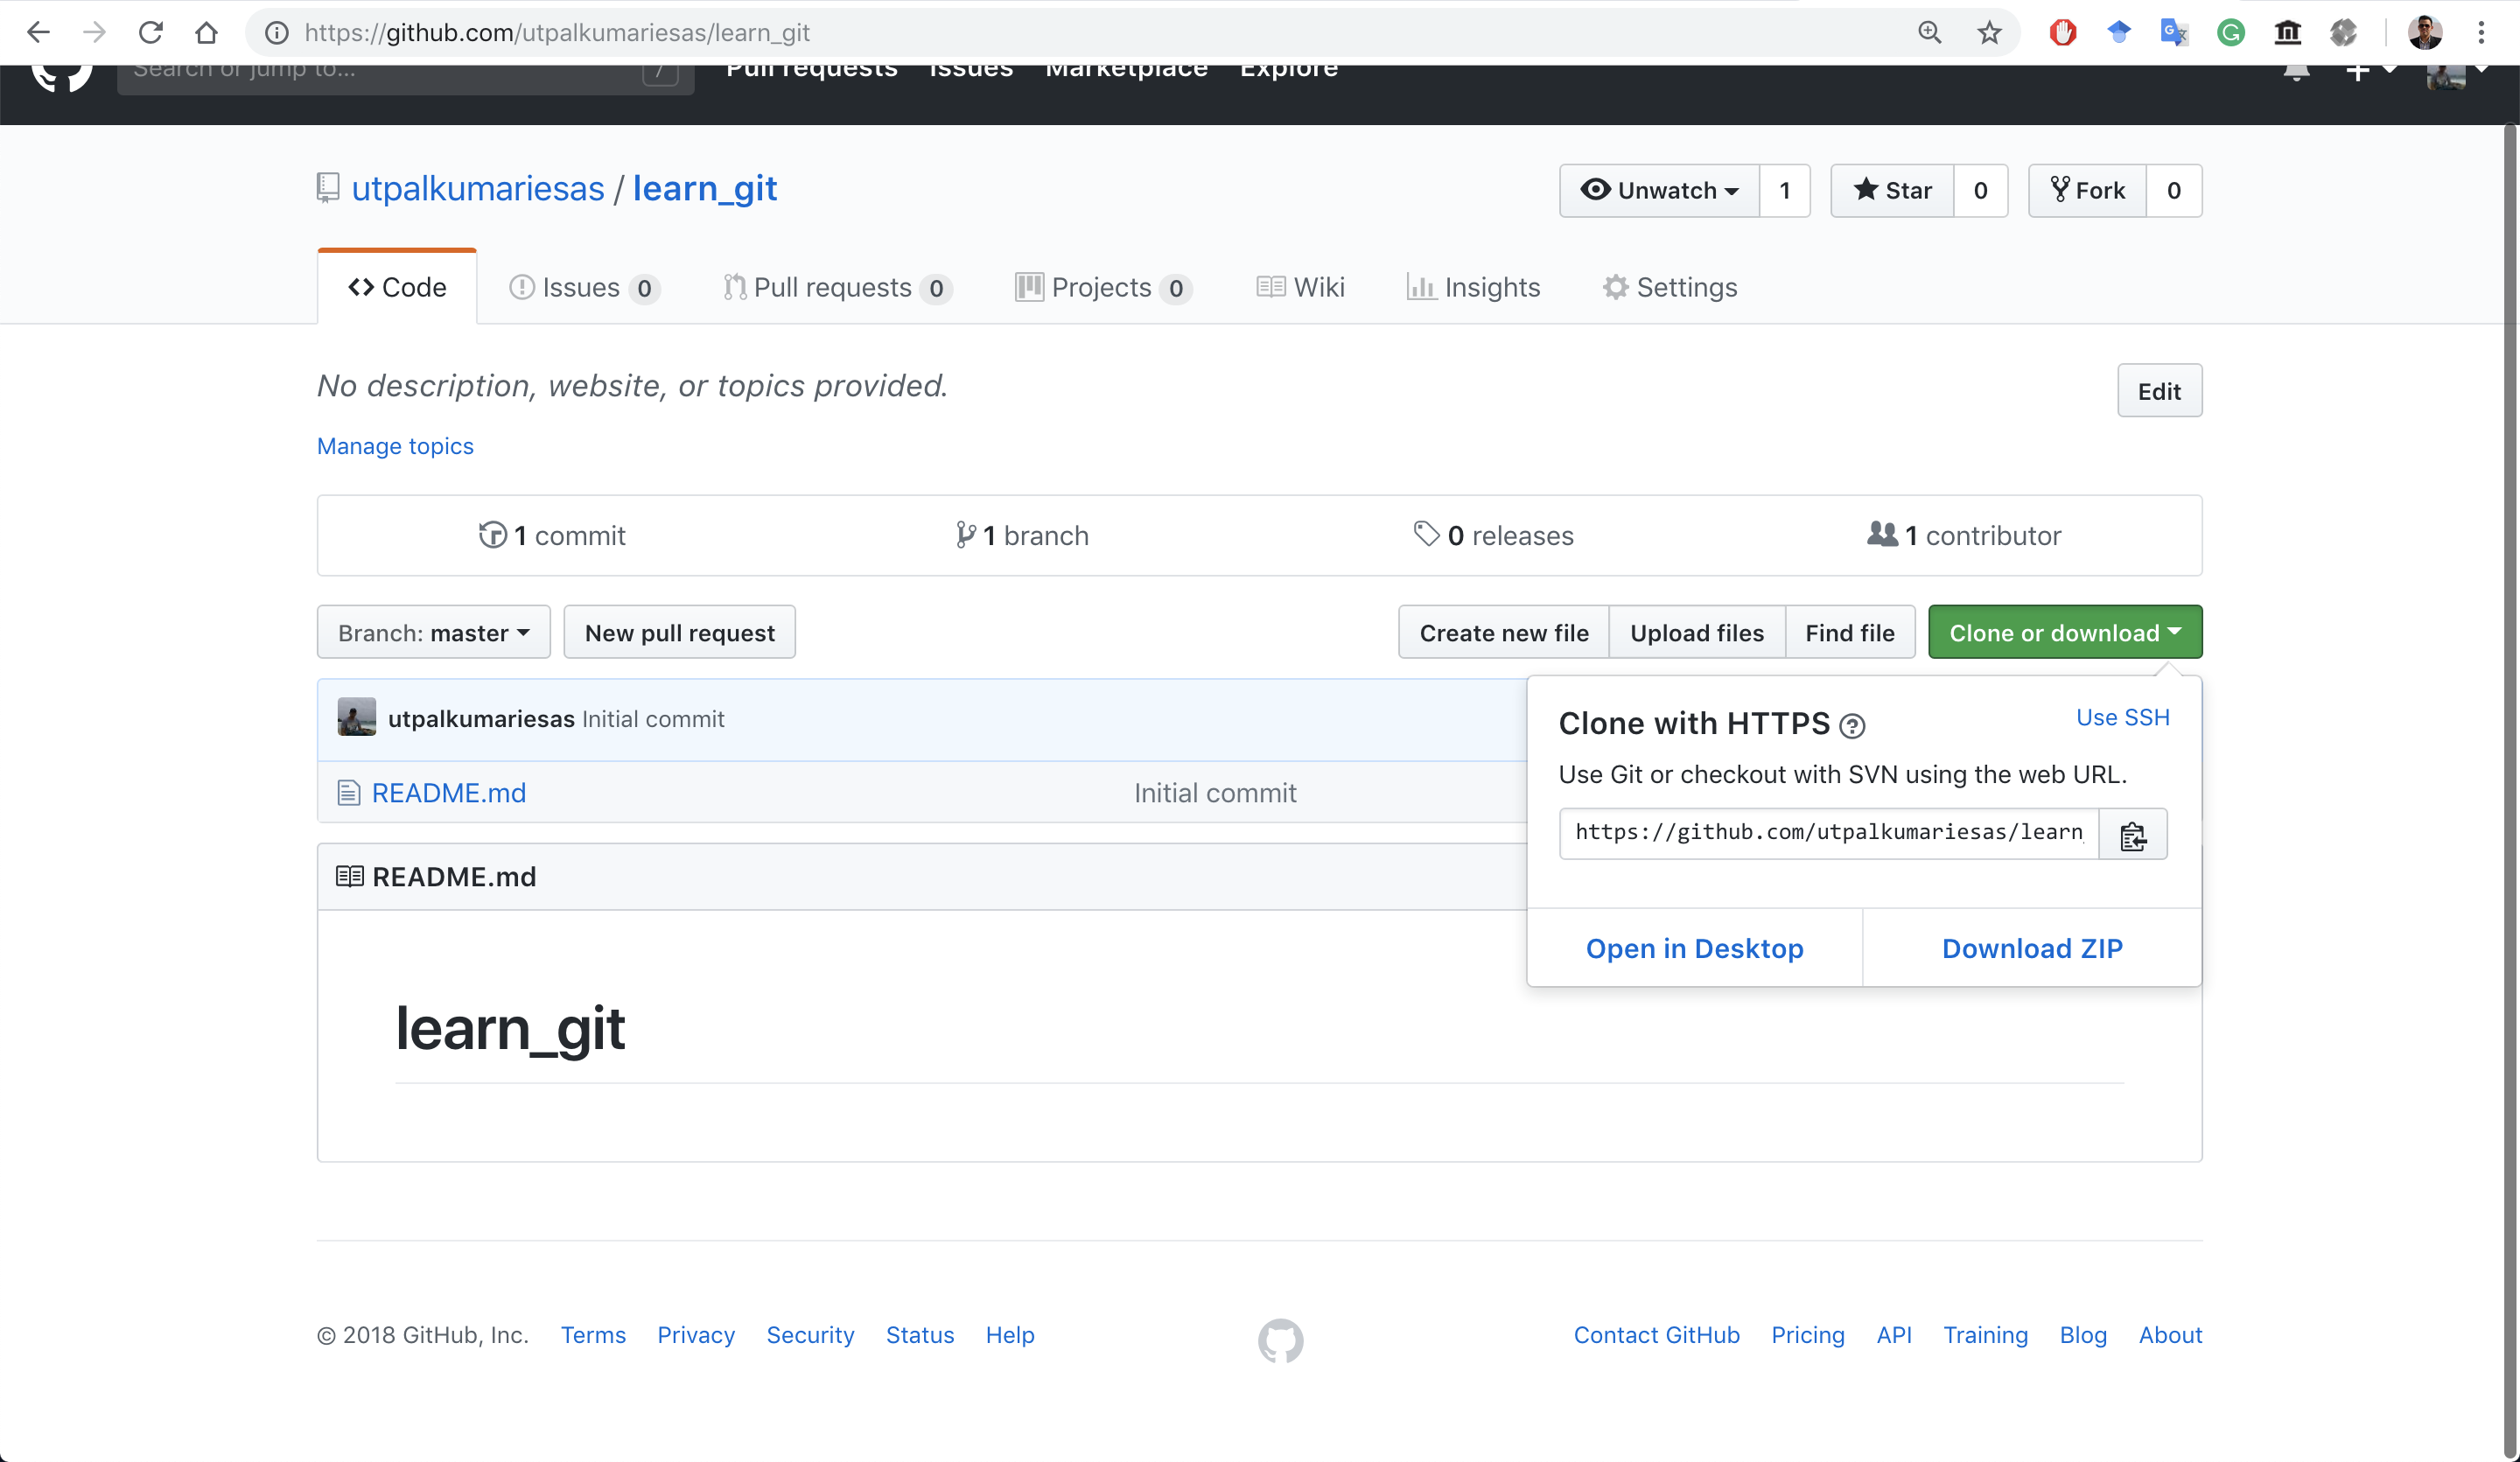
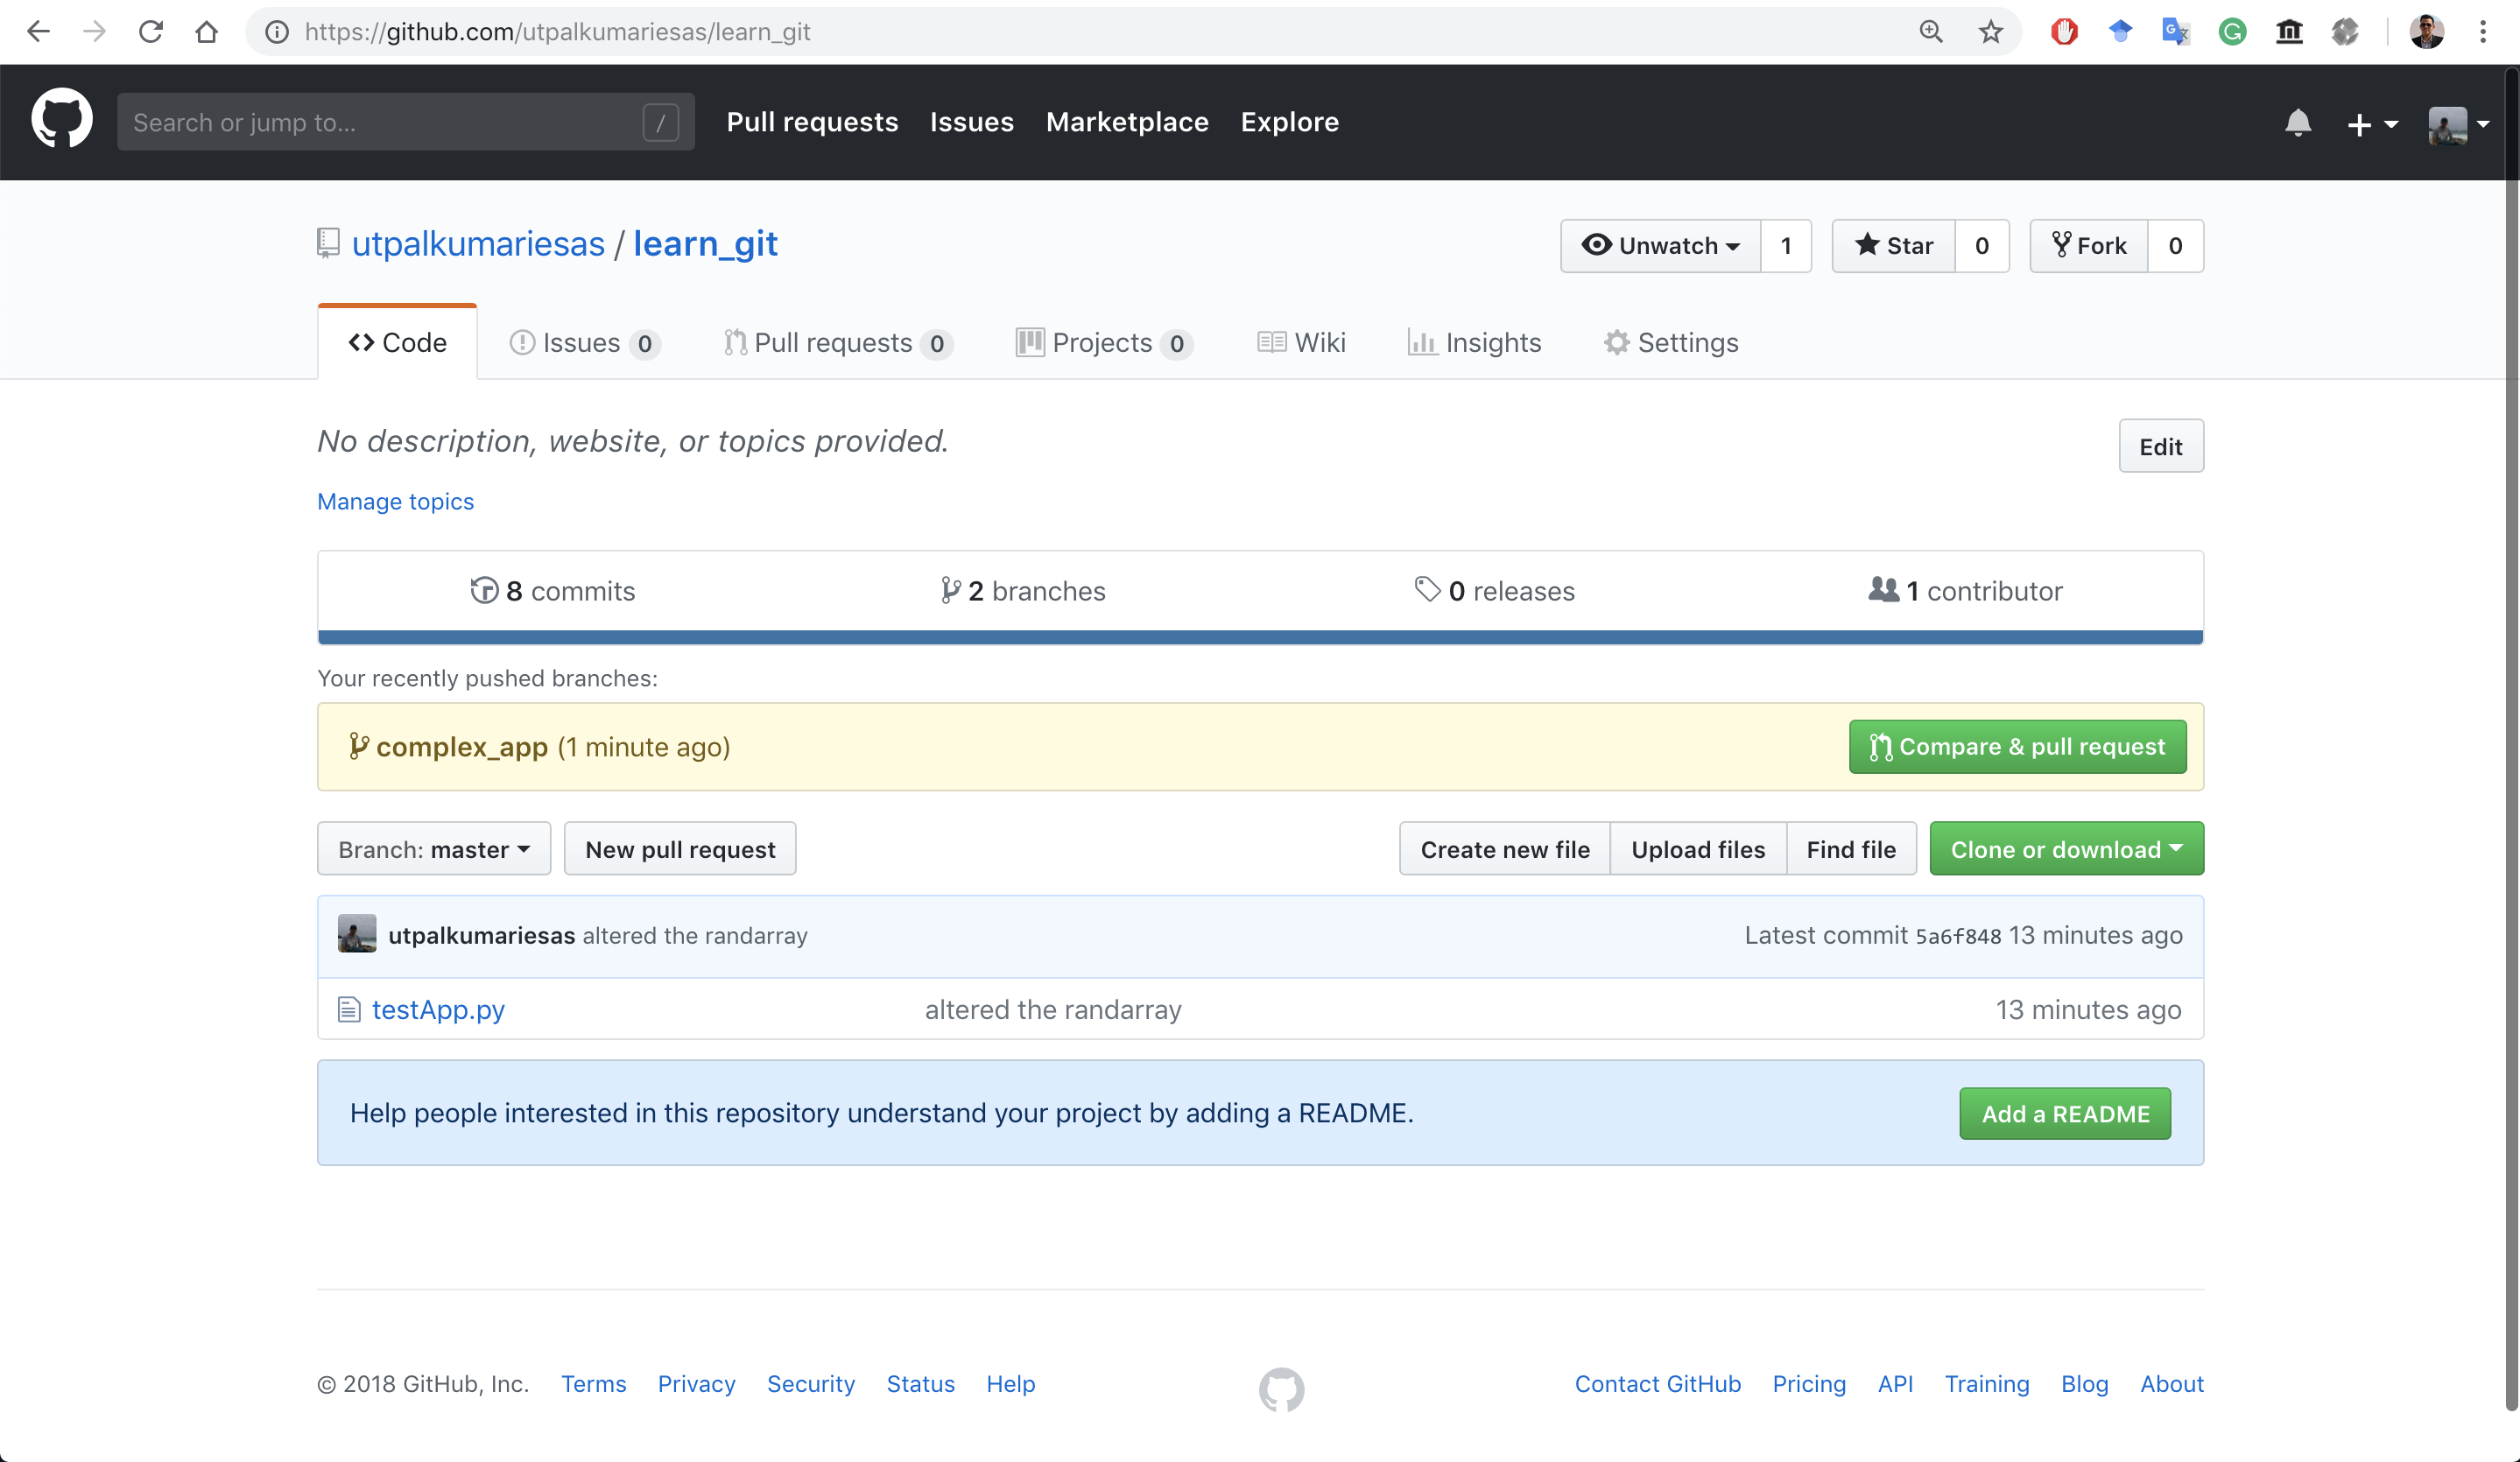
GitHub
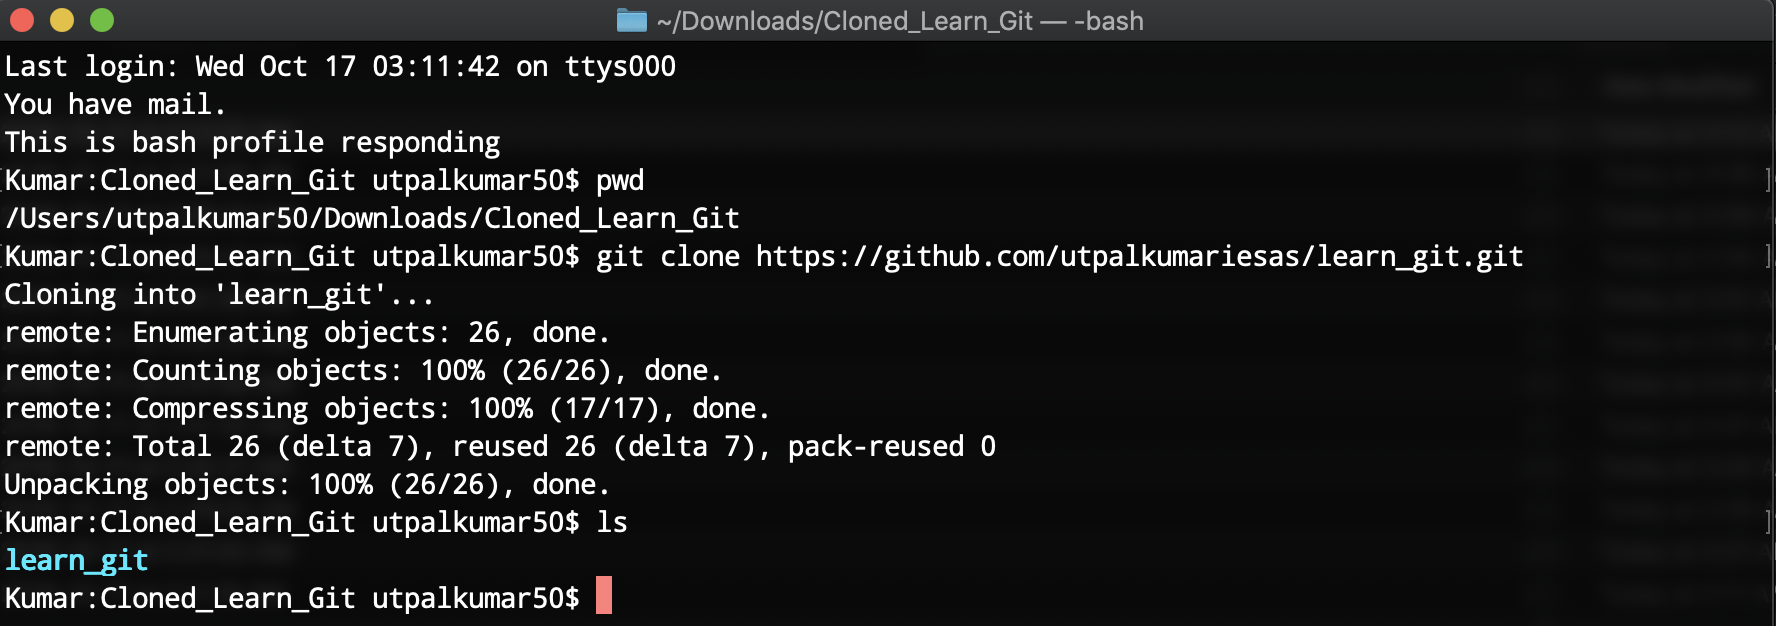
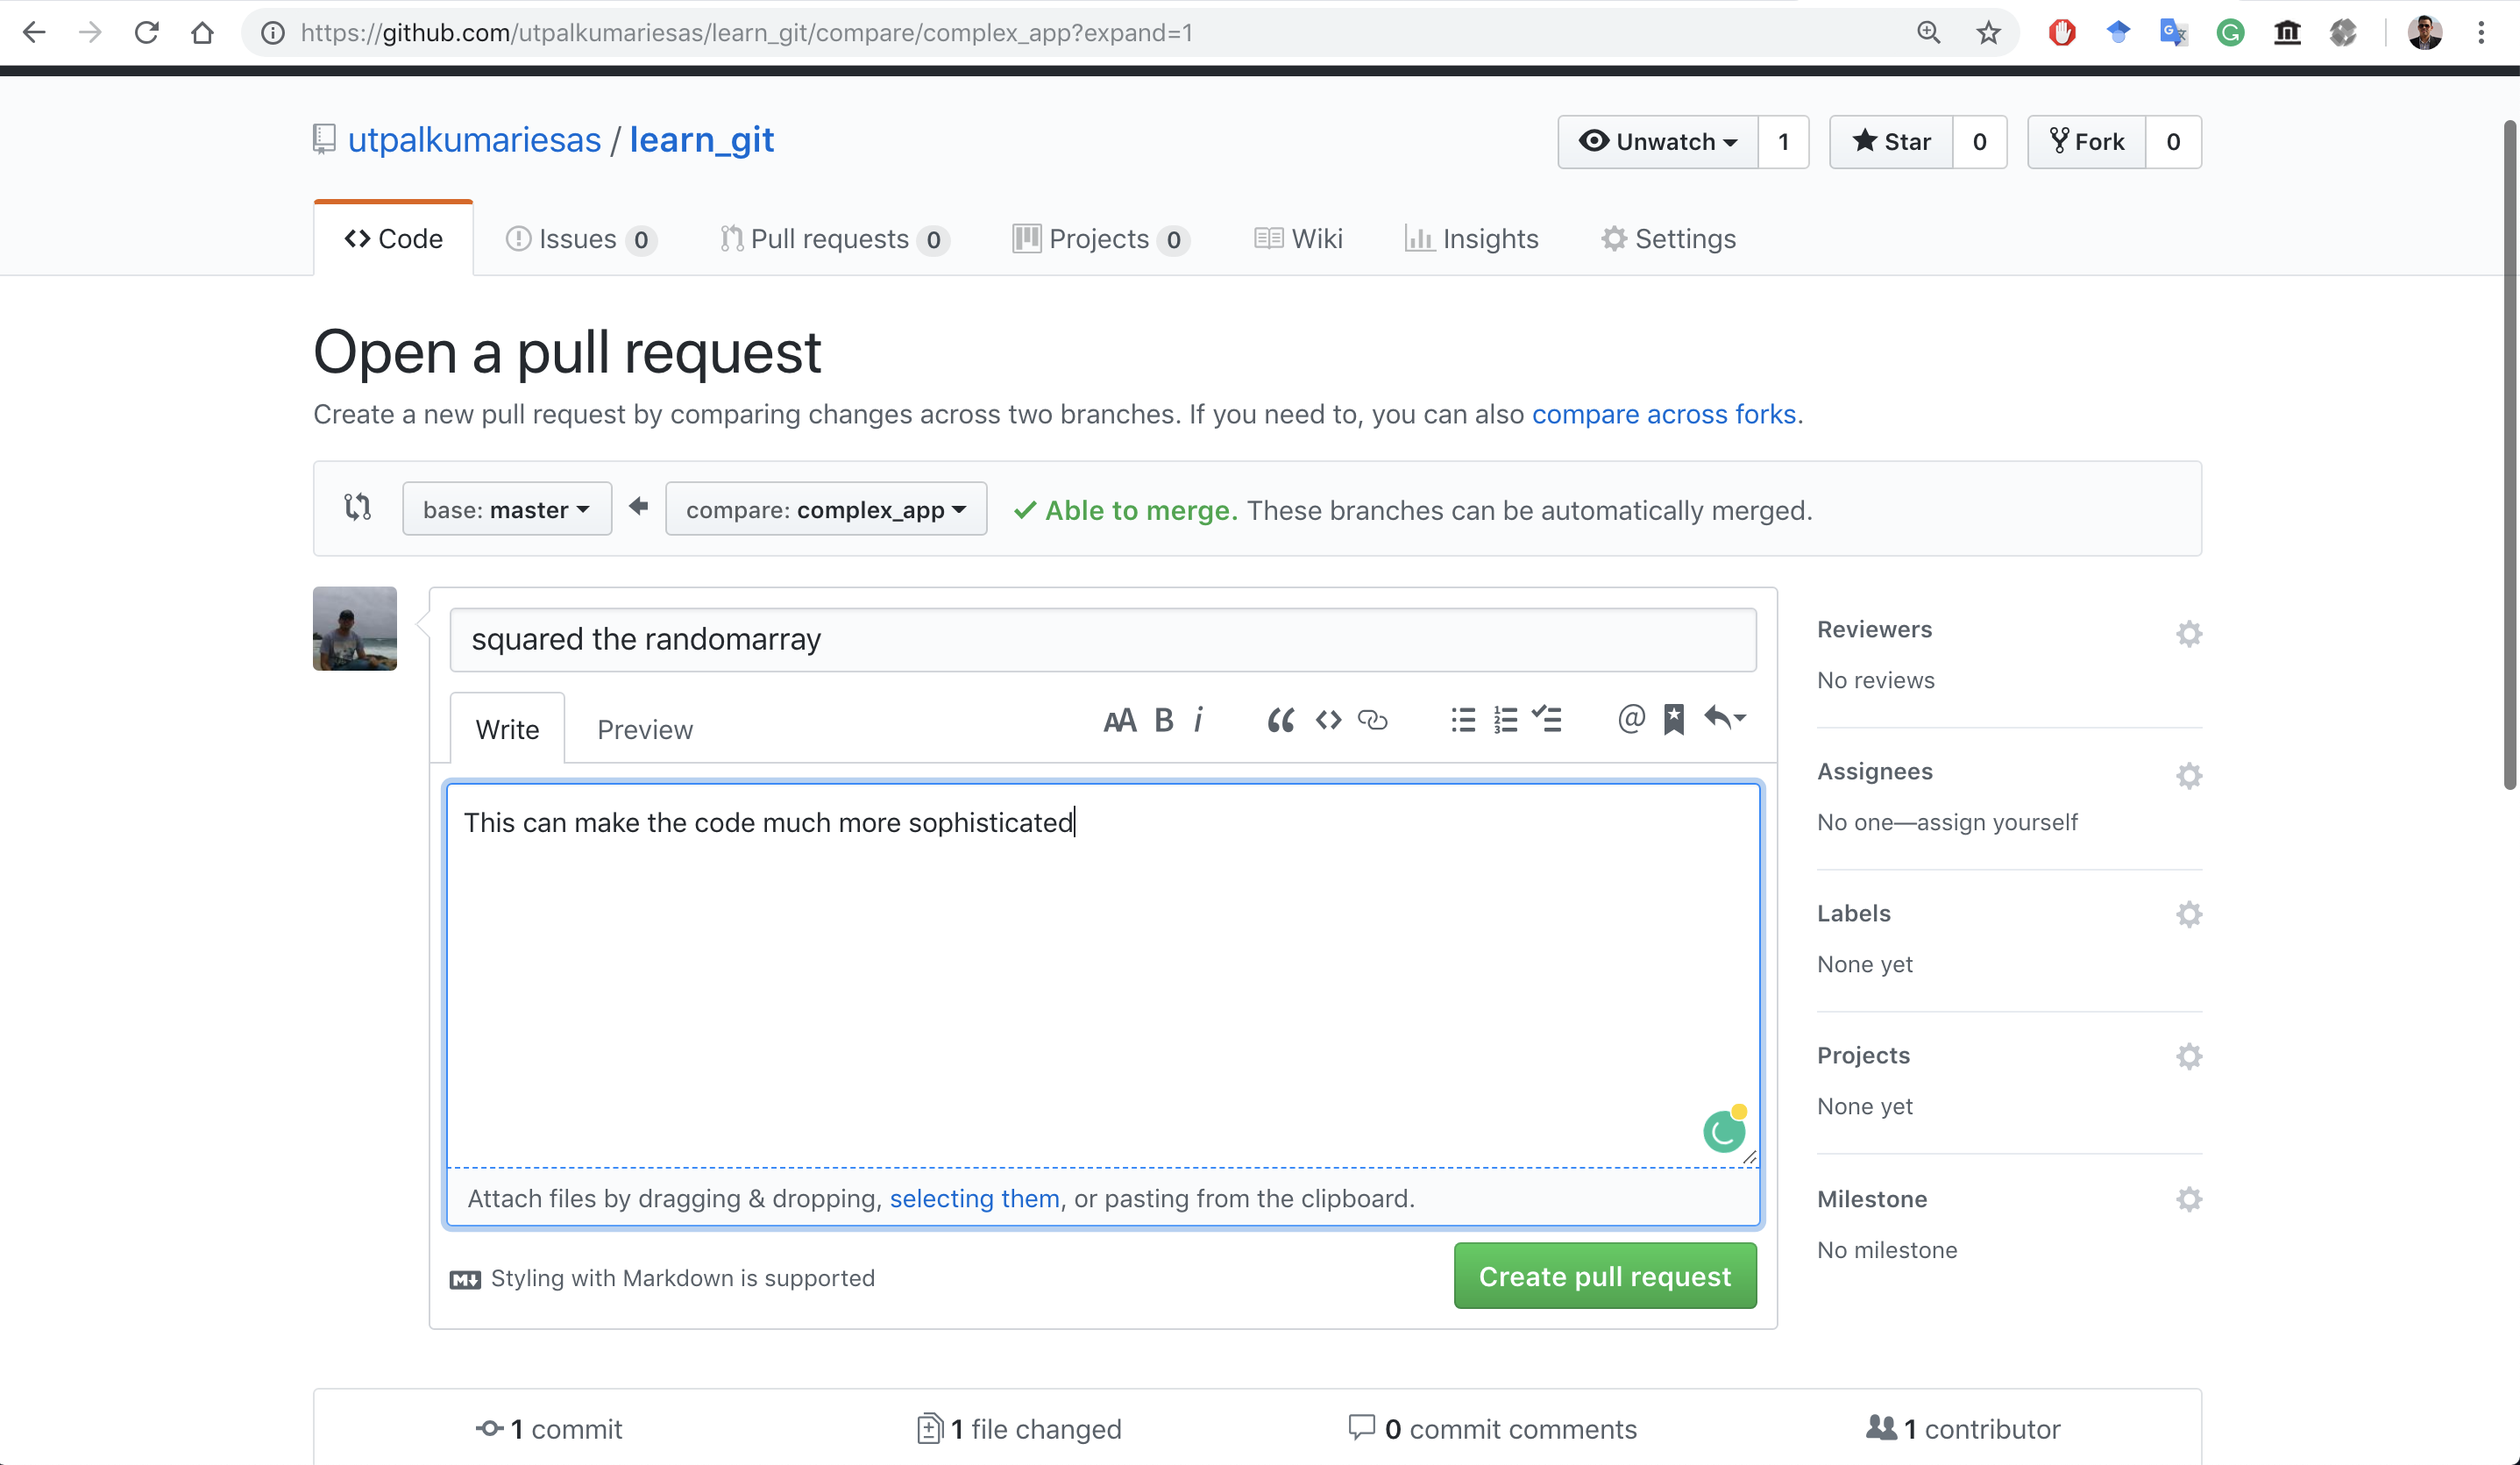
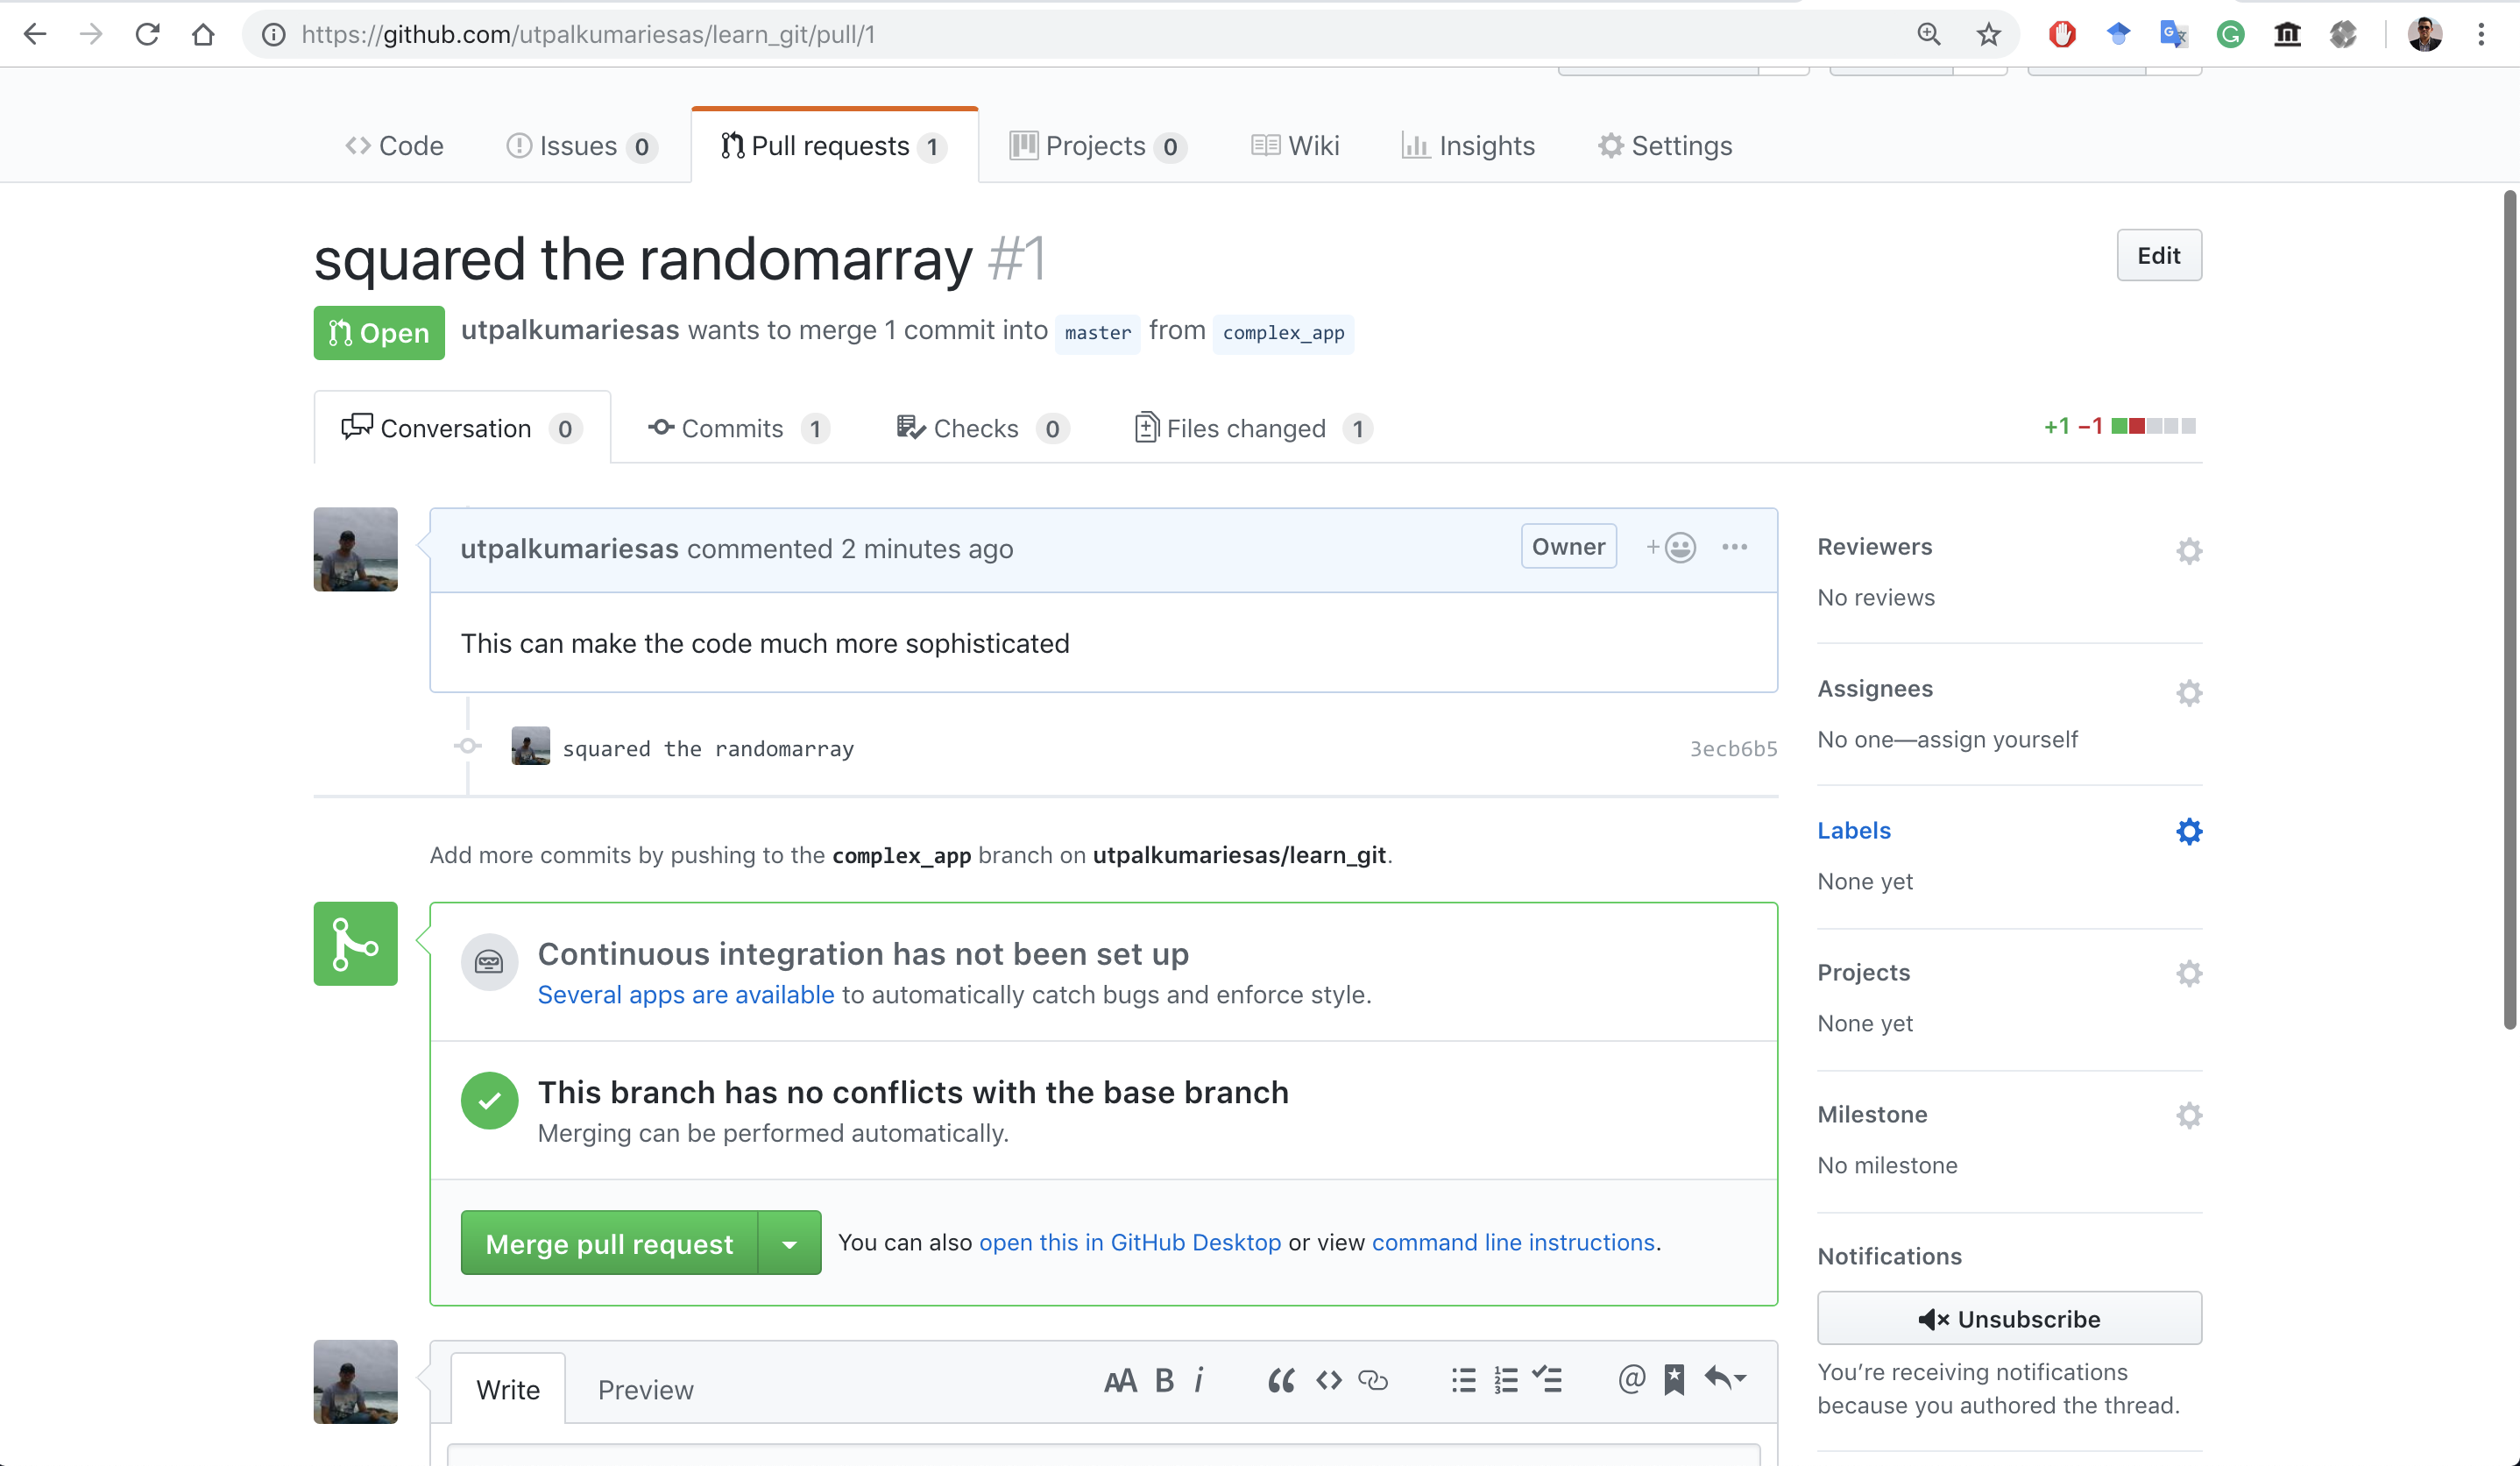
Okay! So far we understood git to some extent. But what is “GitHub”? Well, GitHub is an online service that hosts our projects, helpful in sharing our code to other collaborators of the project. The collaborators can simply download the codes and work on them. They can re-upload their edits and merge with the main codebase.
Installing Git
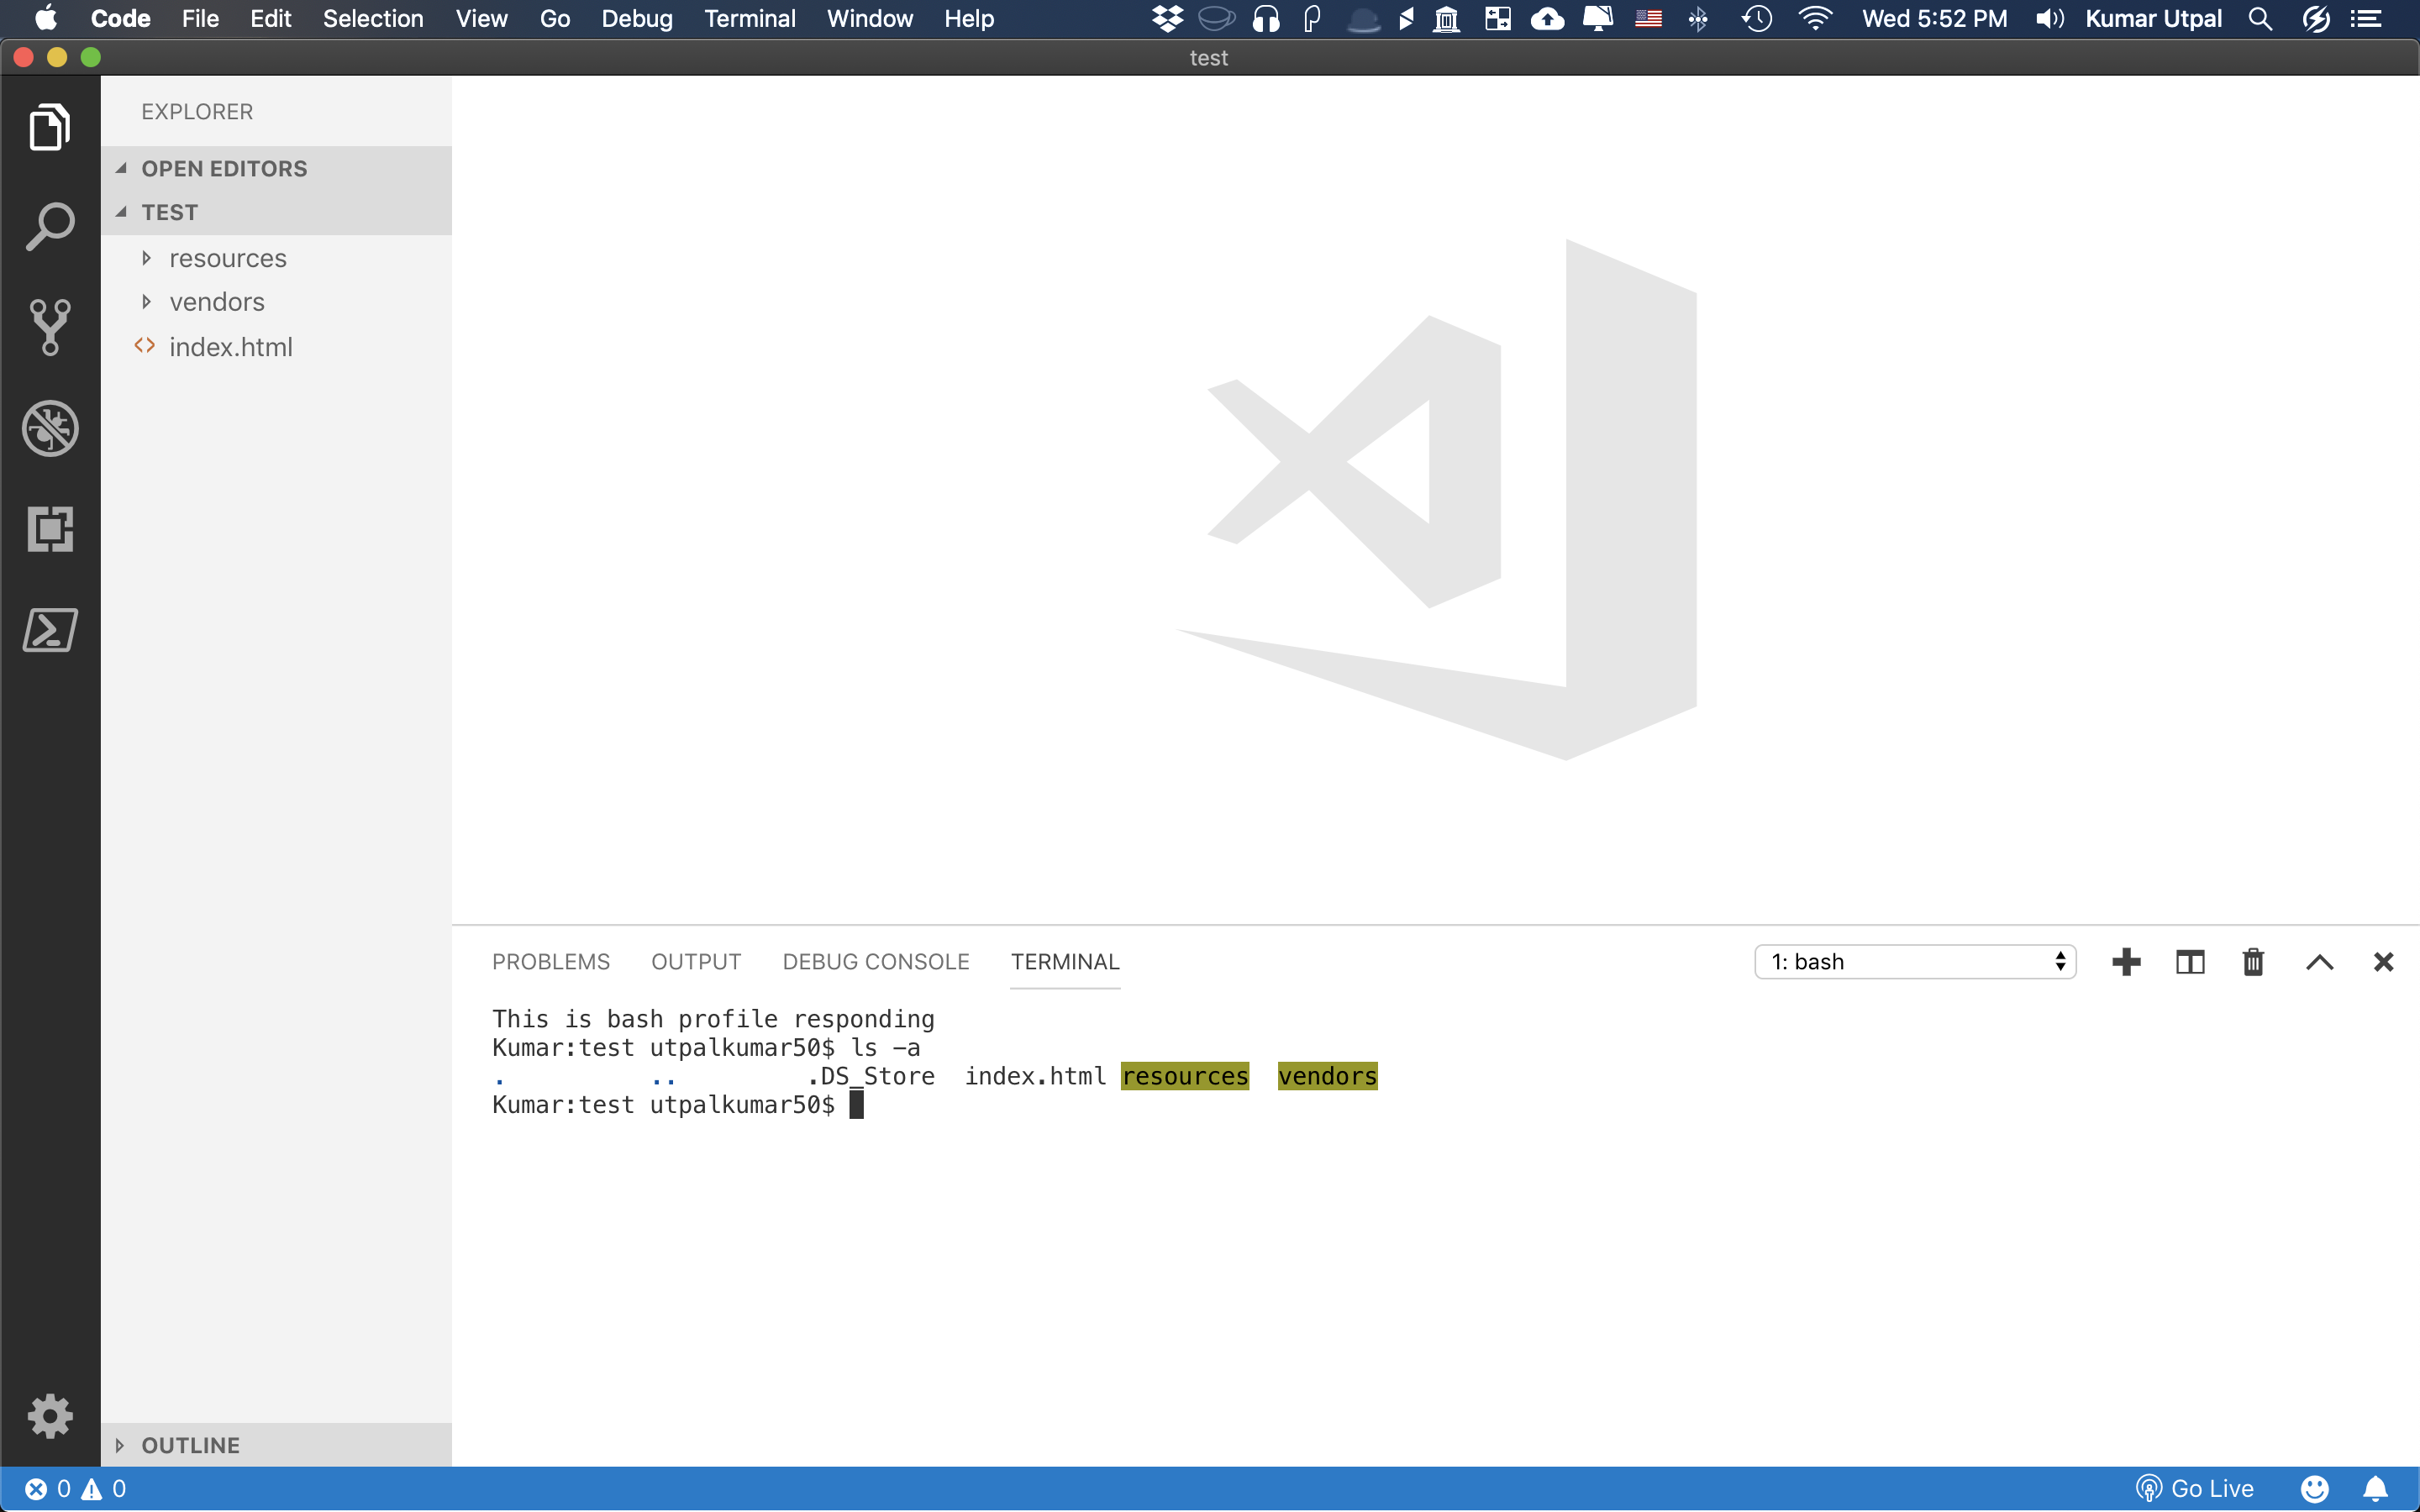
The easiest way is just to download from the link here. Select the download for your operating system and this will download in your computer. Go through the installation steps and that’s it, you have Git now! If you are Windows user, then I’d suggest you install some text editor for writing and running codes. My personal favorite is “VSCode” by Microsoft. It is free, open-source and cross-platform i.e. it provides a similar environment for Windows, Linux, and Mac Users and it has inbuilt “terminal”.
After installing Git and supposedly VSCode then you open and terminal and type
git --version

Setting up Git
Now, after installing Git in your local computer, the first thing that you wanna do is to set it up so that Git could know you. We can tell Git about us by telling the username and email.
git config --global user.name utpalkumar
git config --global user.email utpalkumar50@gmail.com
How Git works?
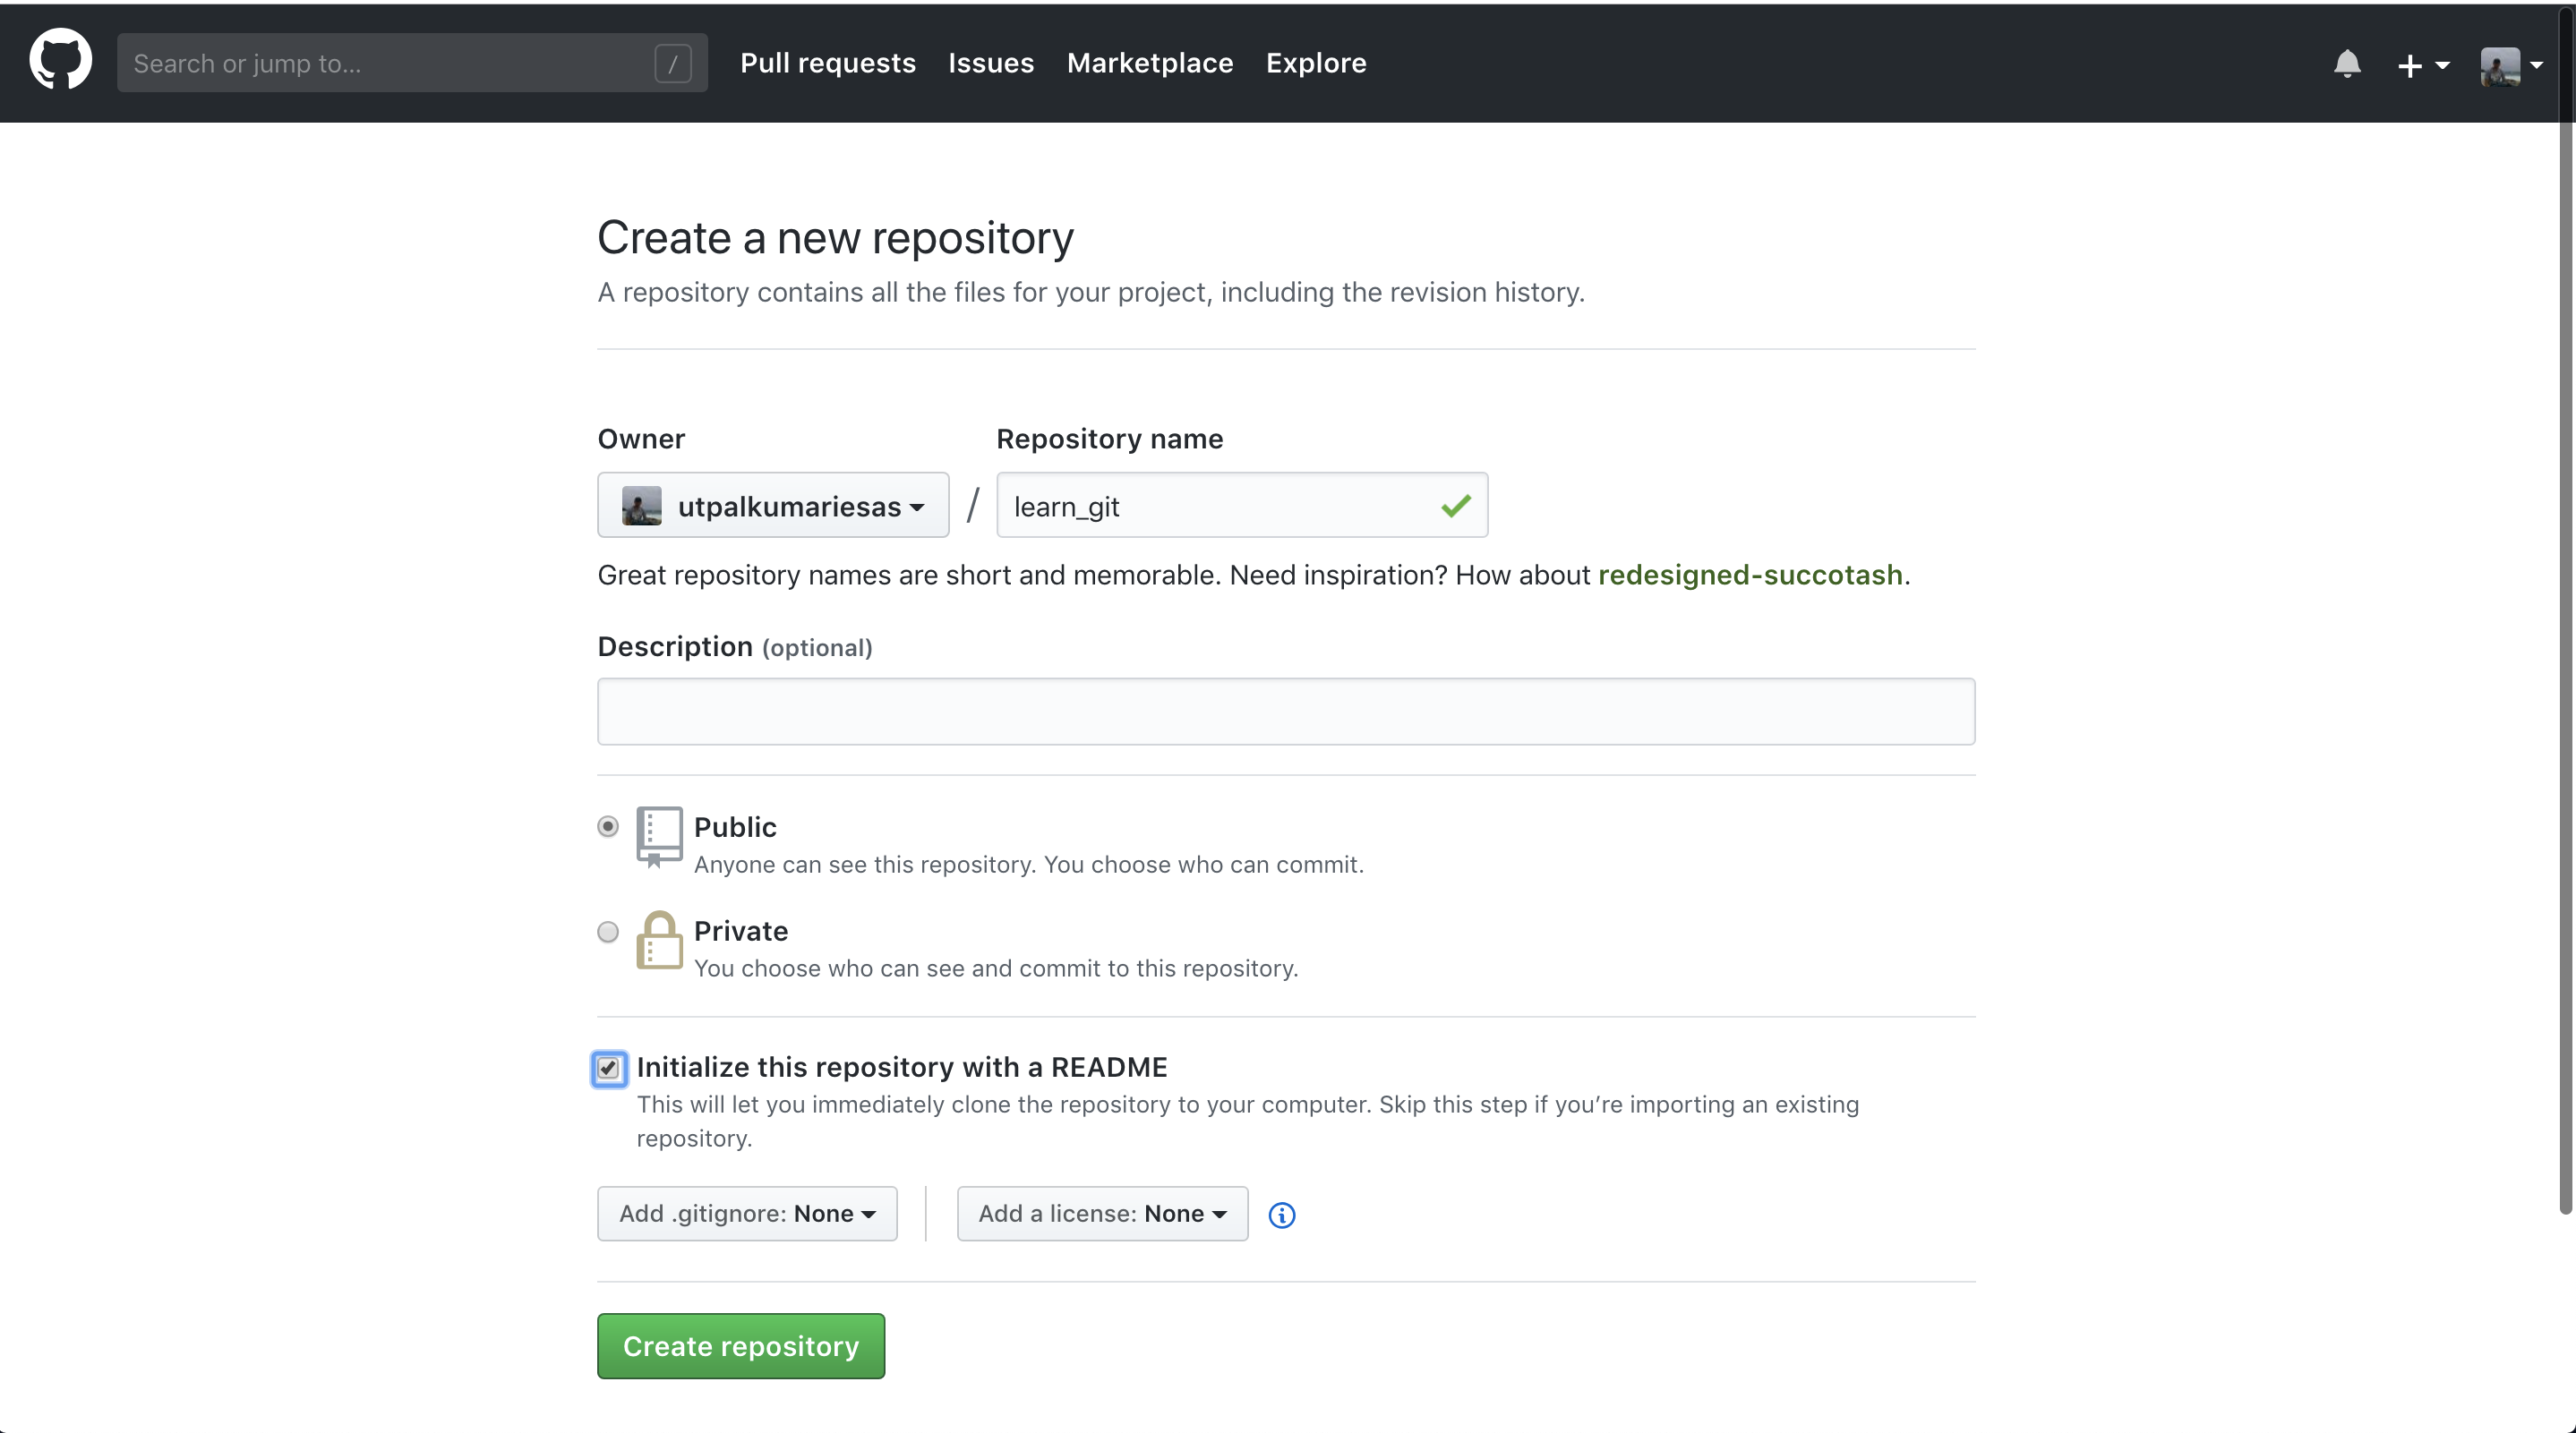
We make a container for our project where we dump all our codes and it is popularly called repositories (or repo, for short). We can have a repository on our local computer as well as remotely on some kind of online repository hosting service like GitHub. We can track the contents of the repository using Git. Git tracks the history of the contents of the repository using the so-called “commits”. Commits are the different points in the history of making the repository where we have told the Git to save. We tell the Git to save the version using the “commit” command which we will see in detail later. If we have made, say 5 commits to our repository, we can roll back to any previous commit smoothly.
Creating a repository
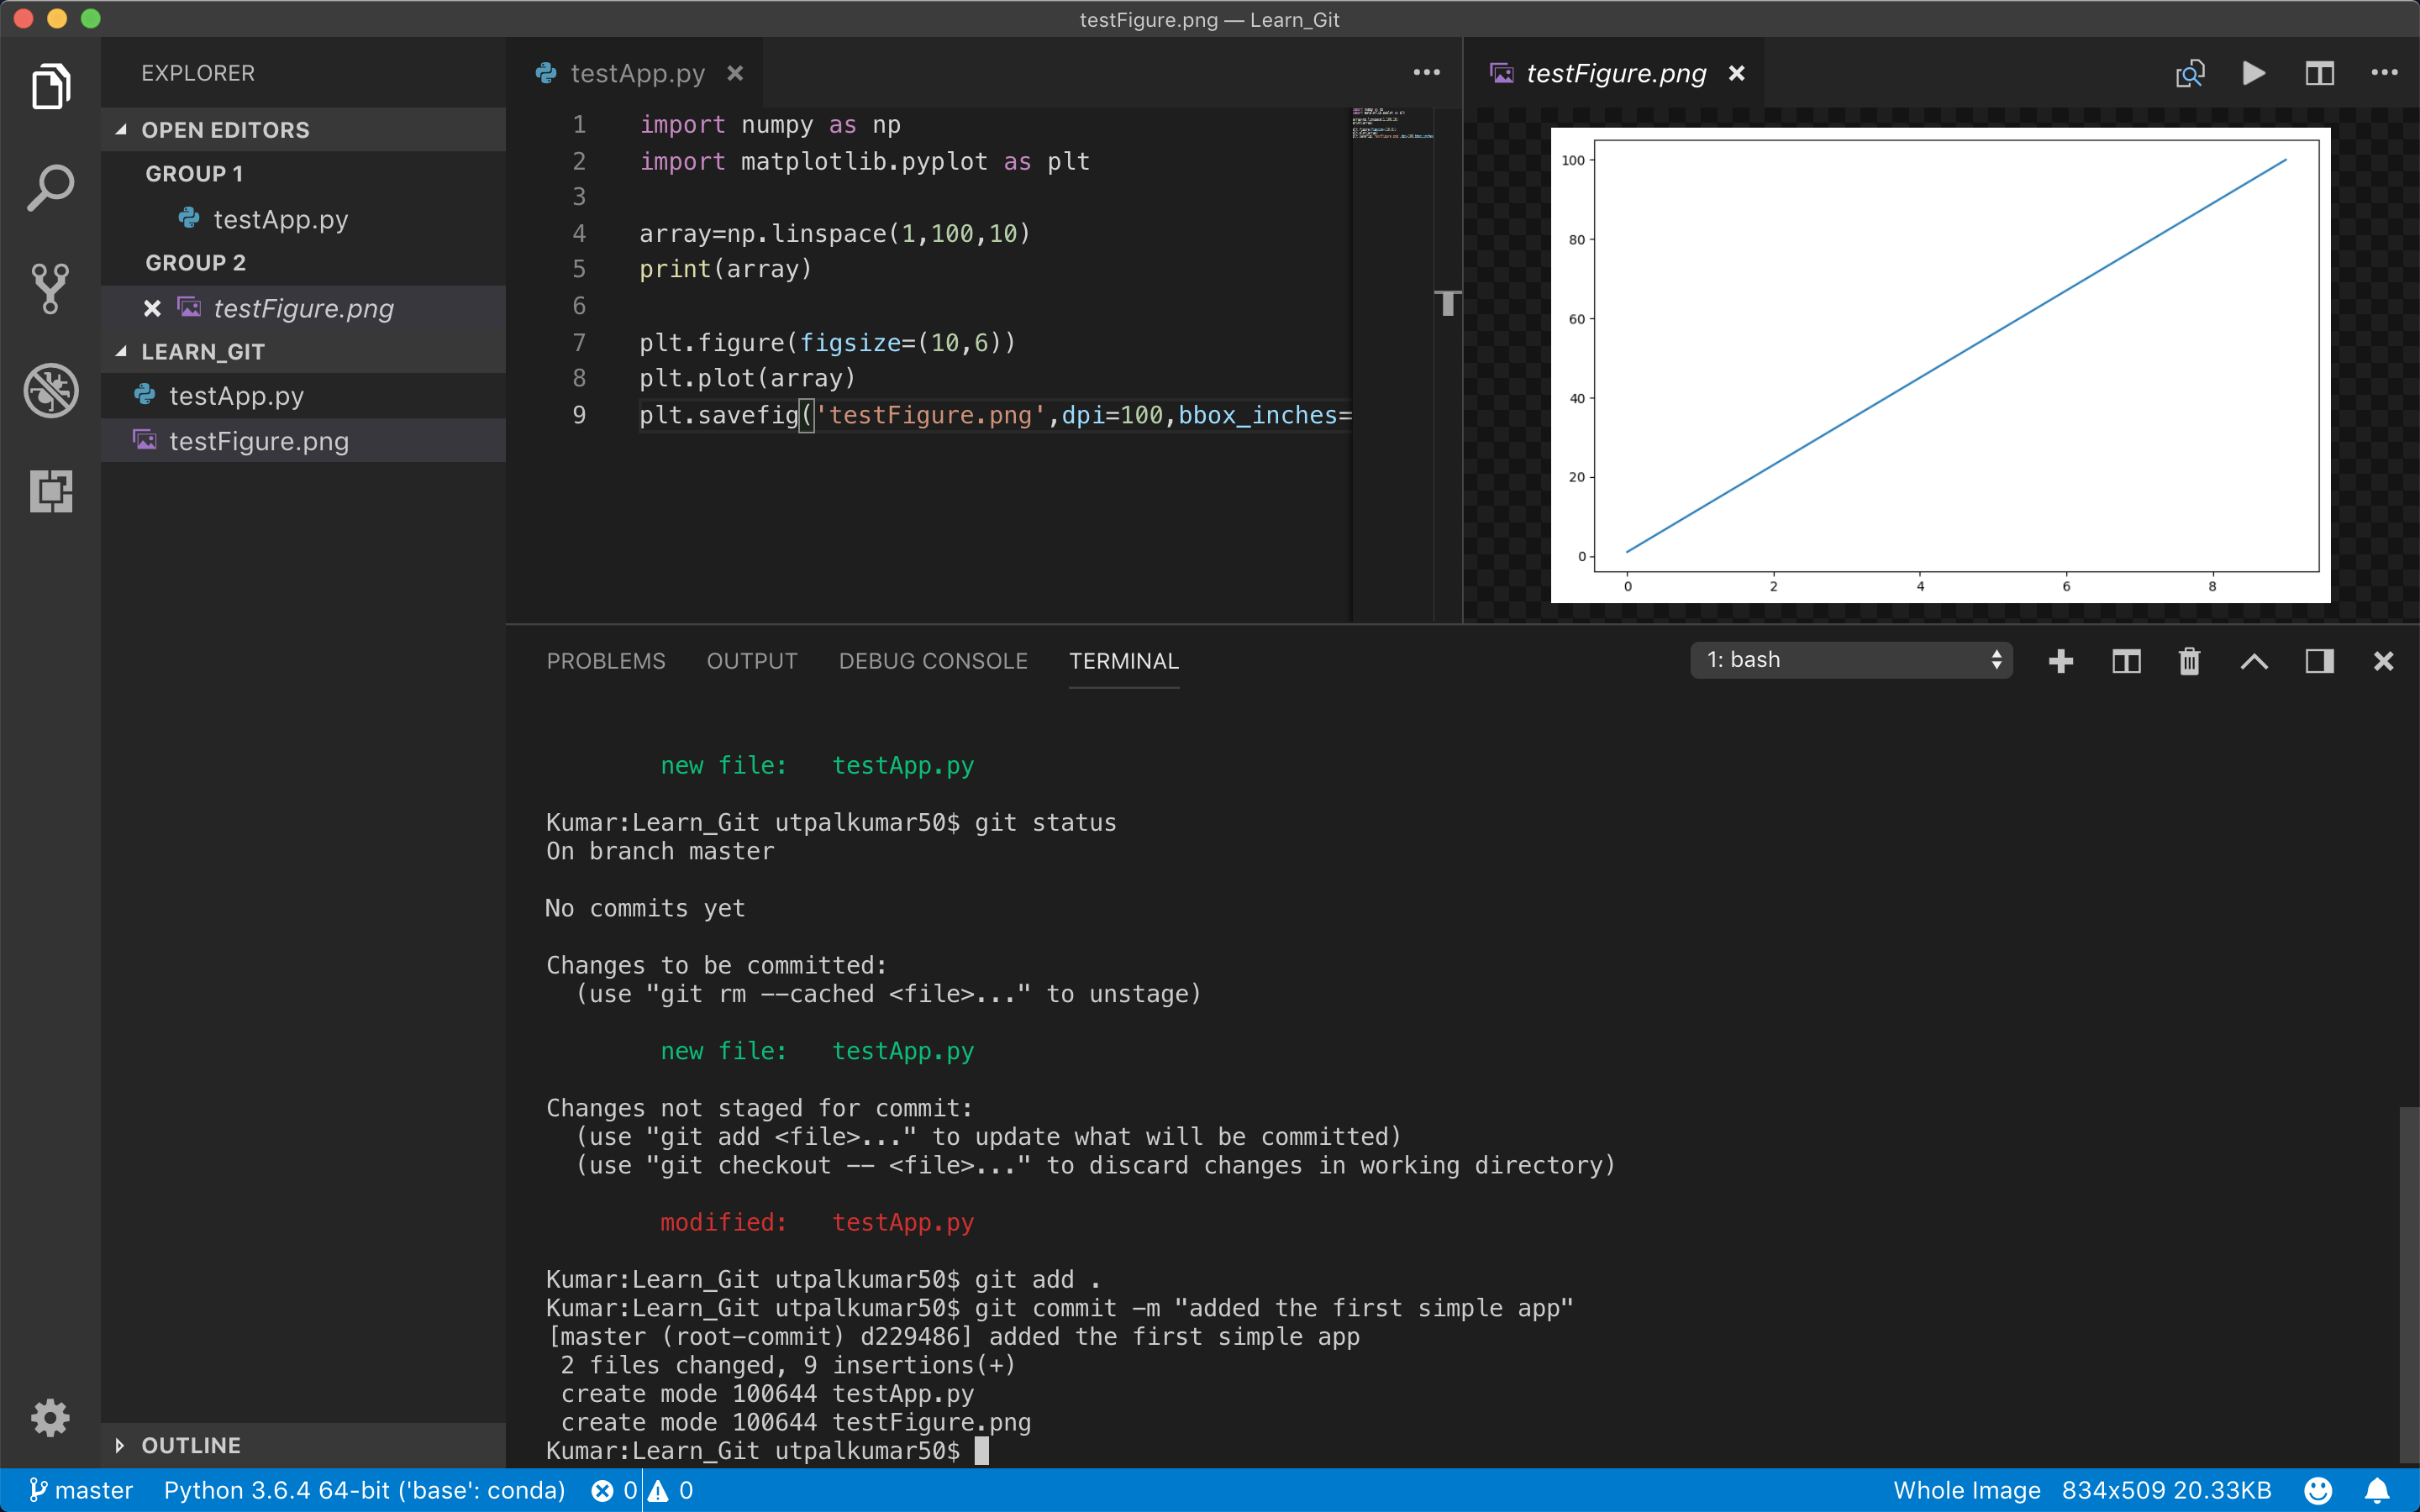
We first open an editor and a terminal for typing the commands. In VSCode, we can do it both in one window.
Make sure the terminal and the editor points to the same path.
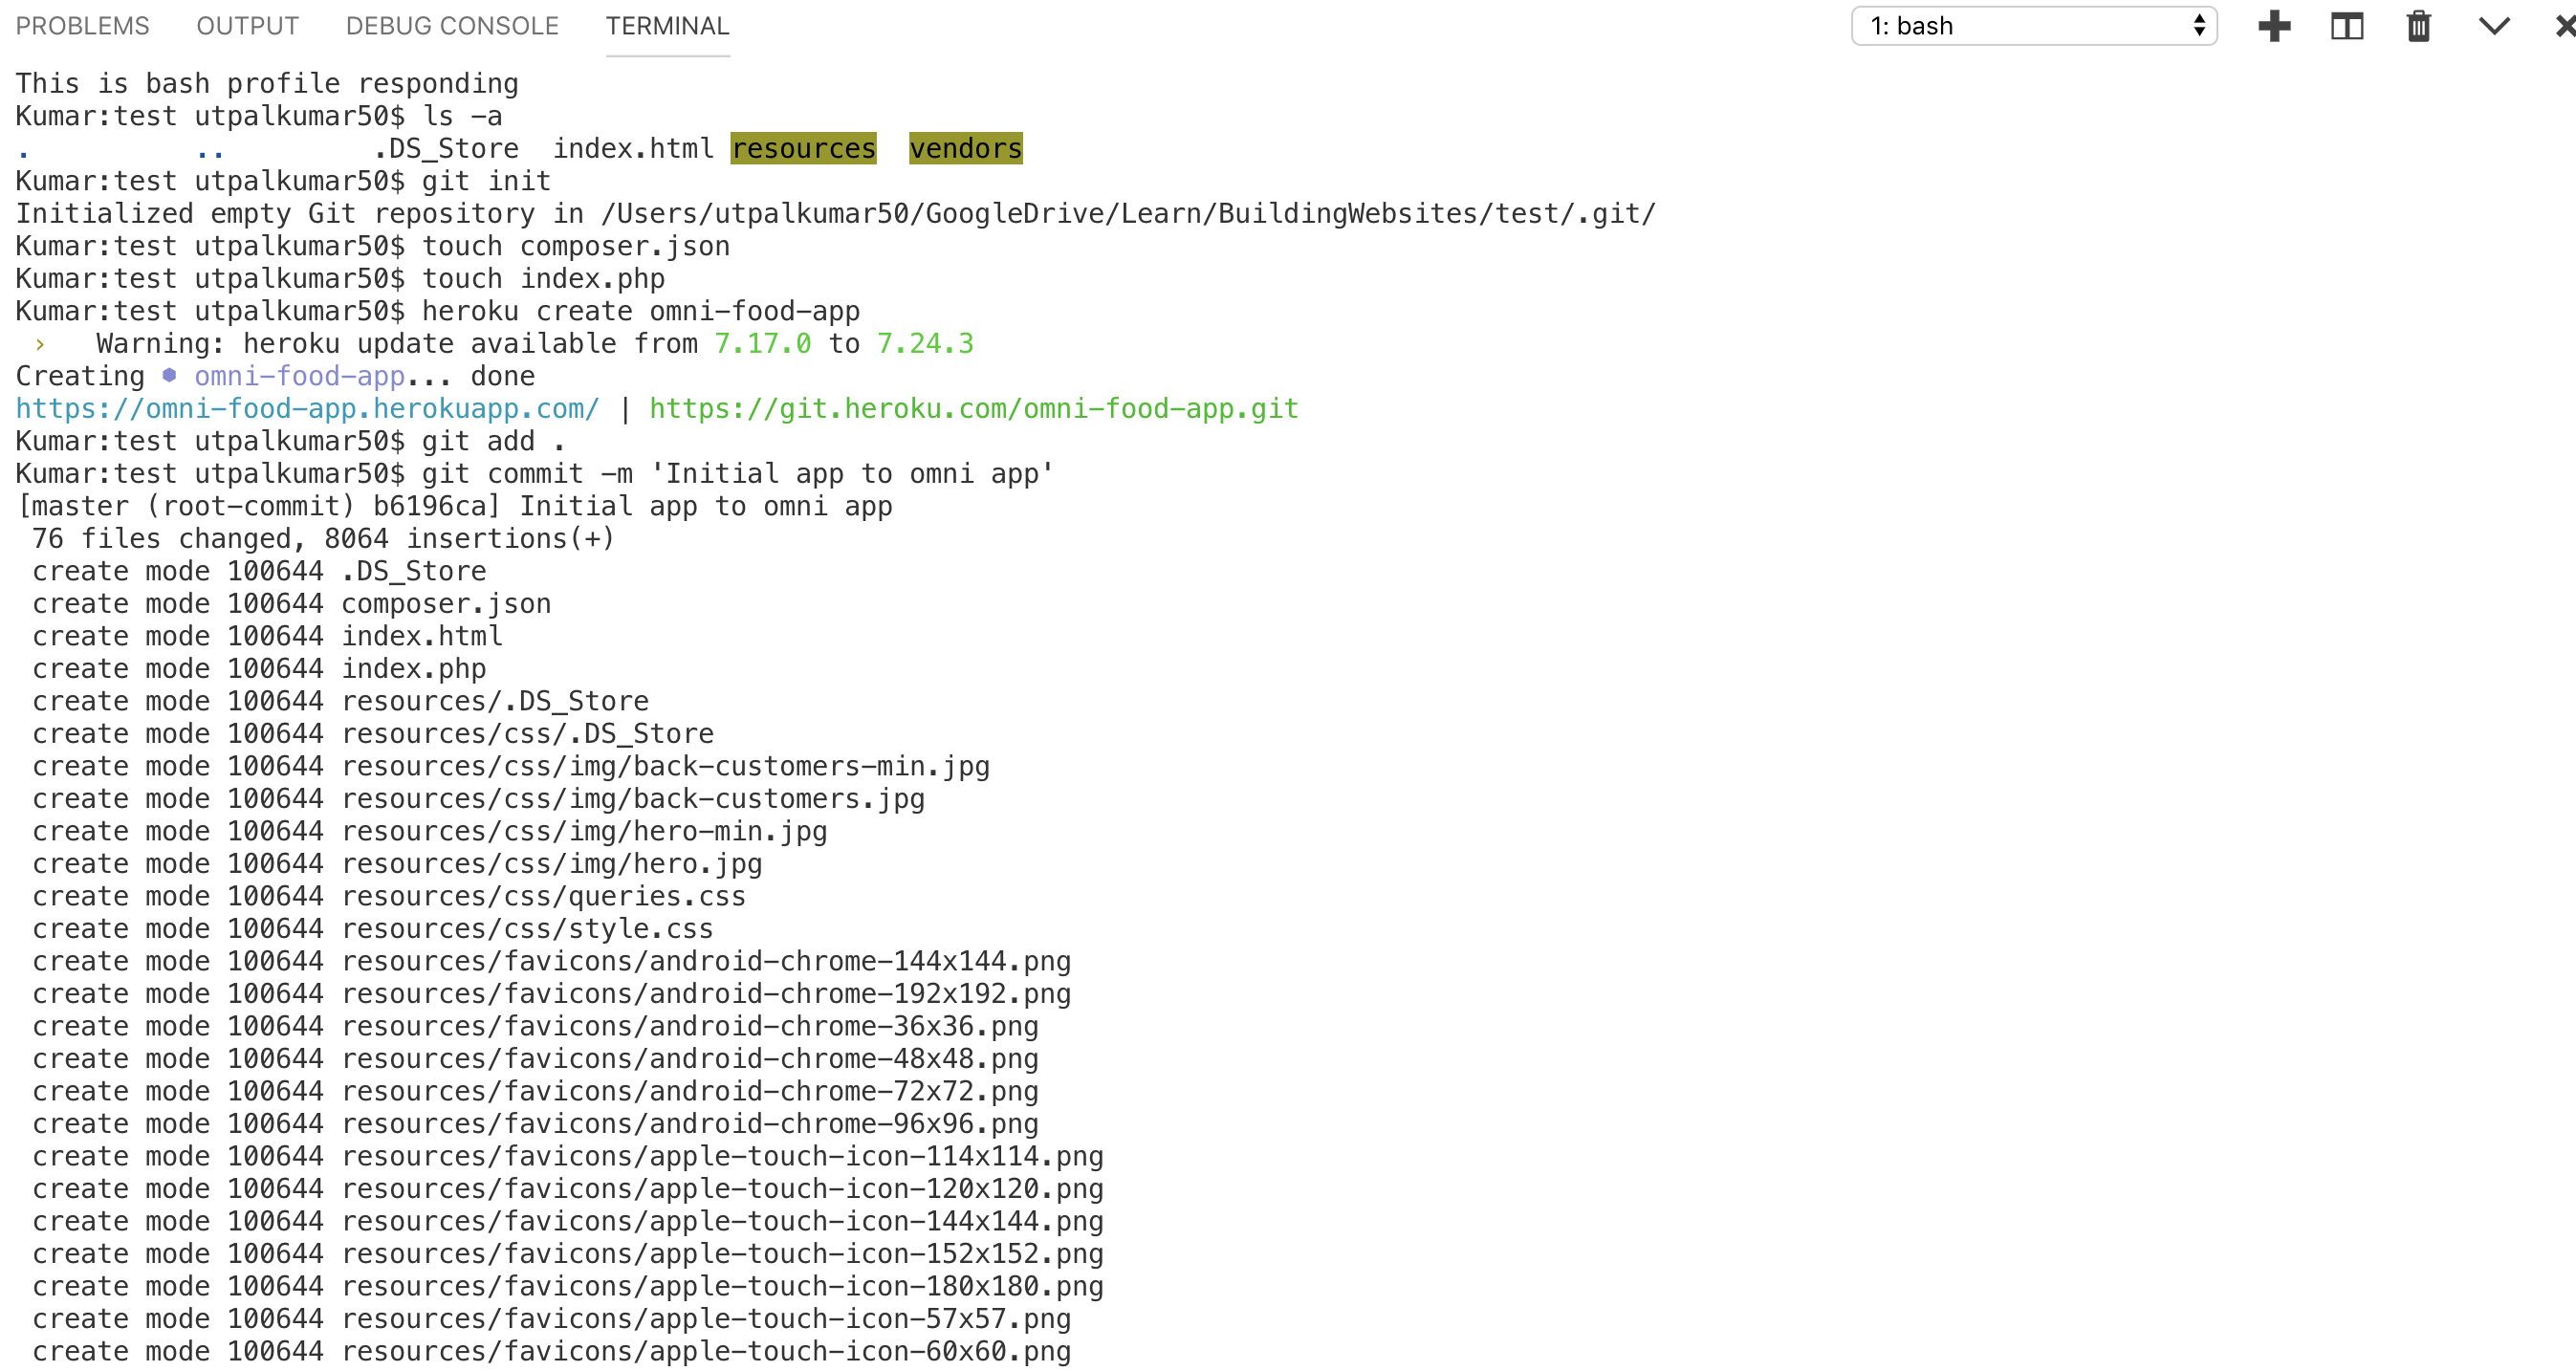
- To initialize empty Git repository in the directory, we type in the terminal:
git init
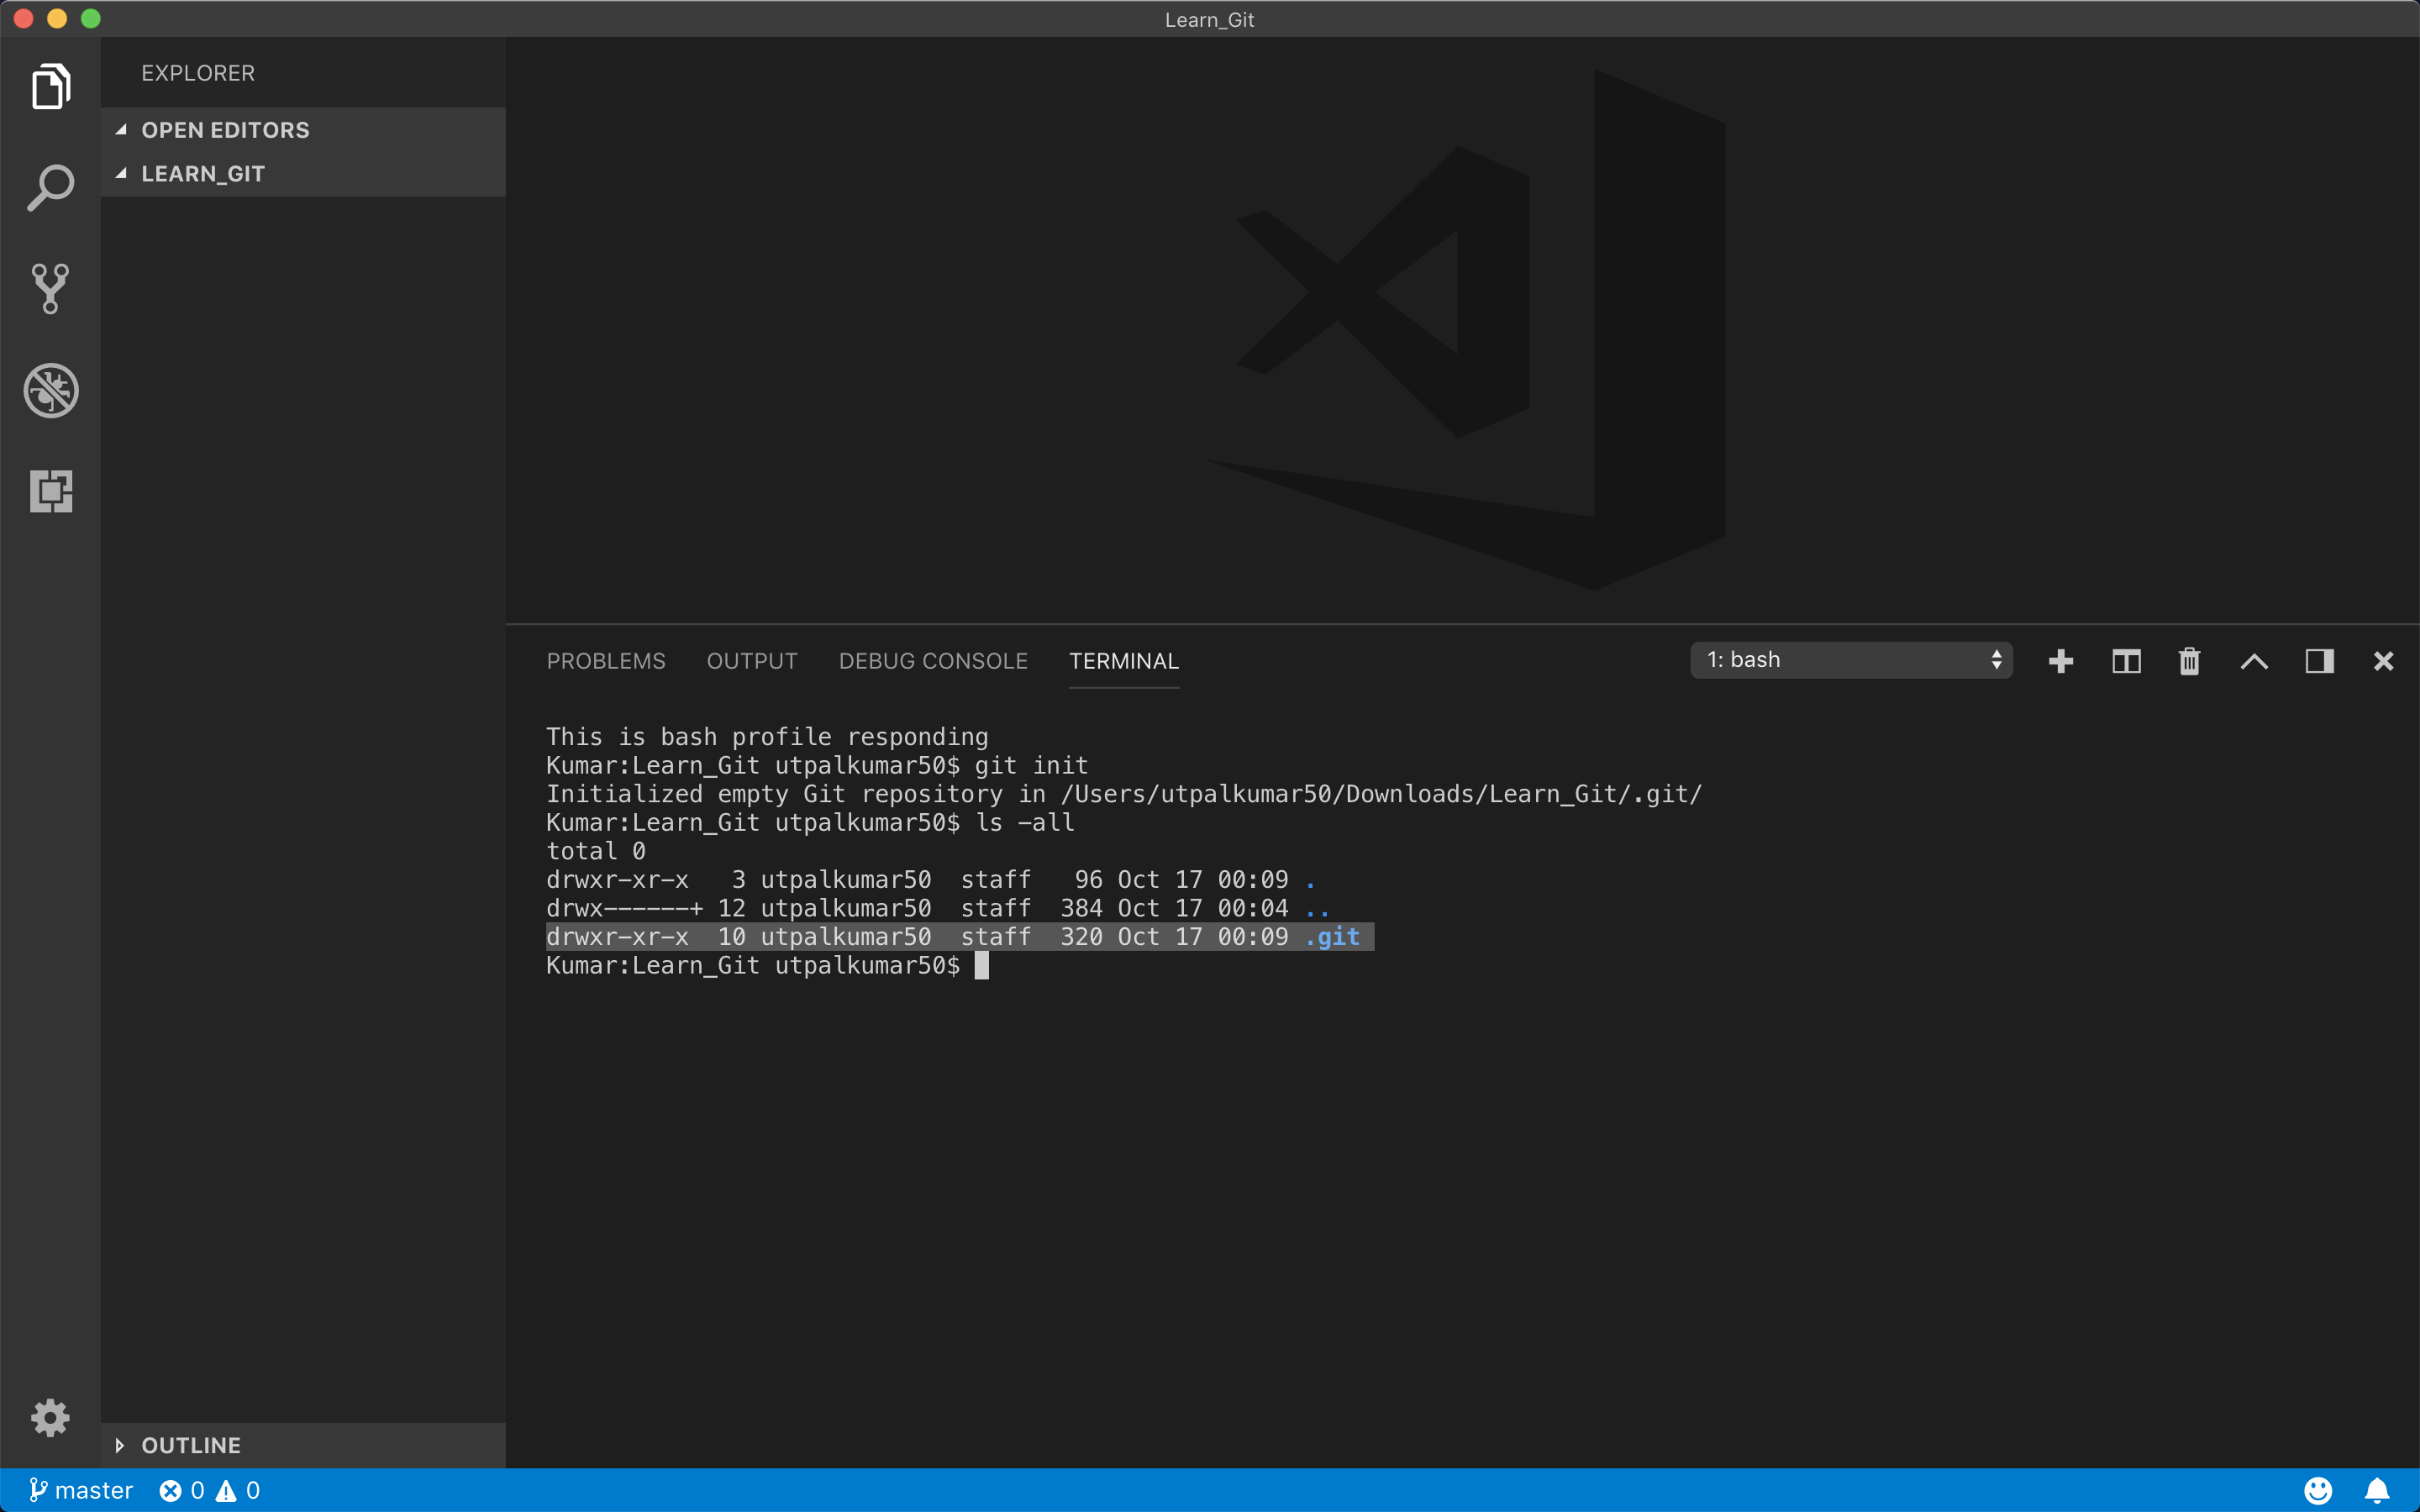
The existence of the .git directory in our working directory shows that this is now the git repository. We can even initialize Git in a directory which already has contents in the same way.
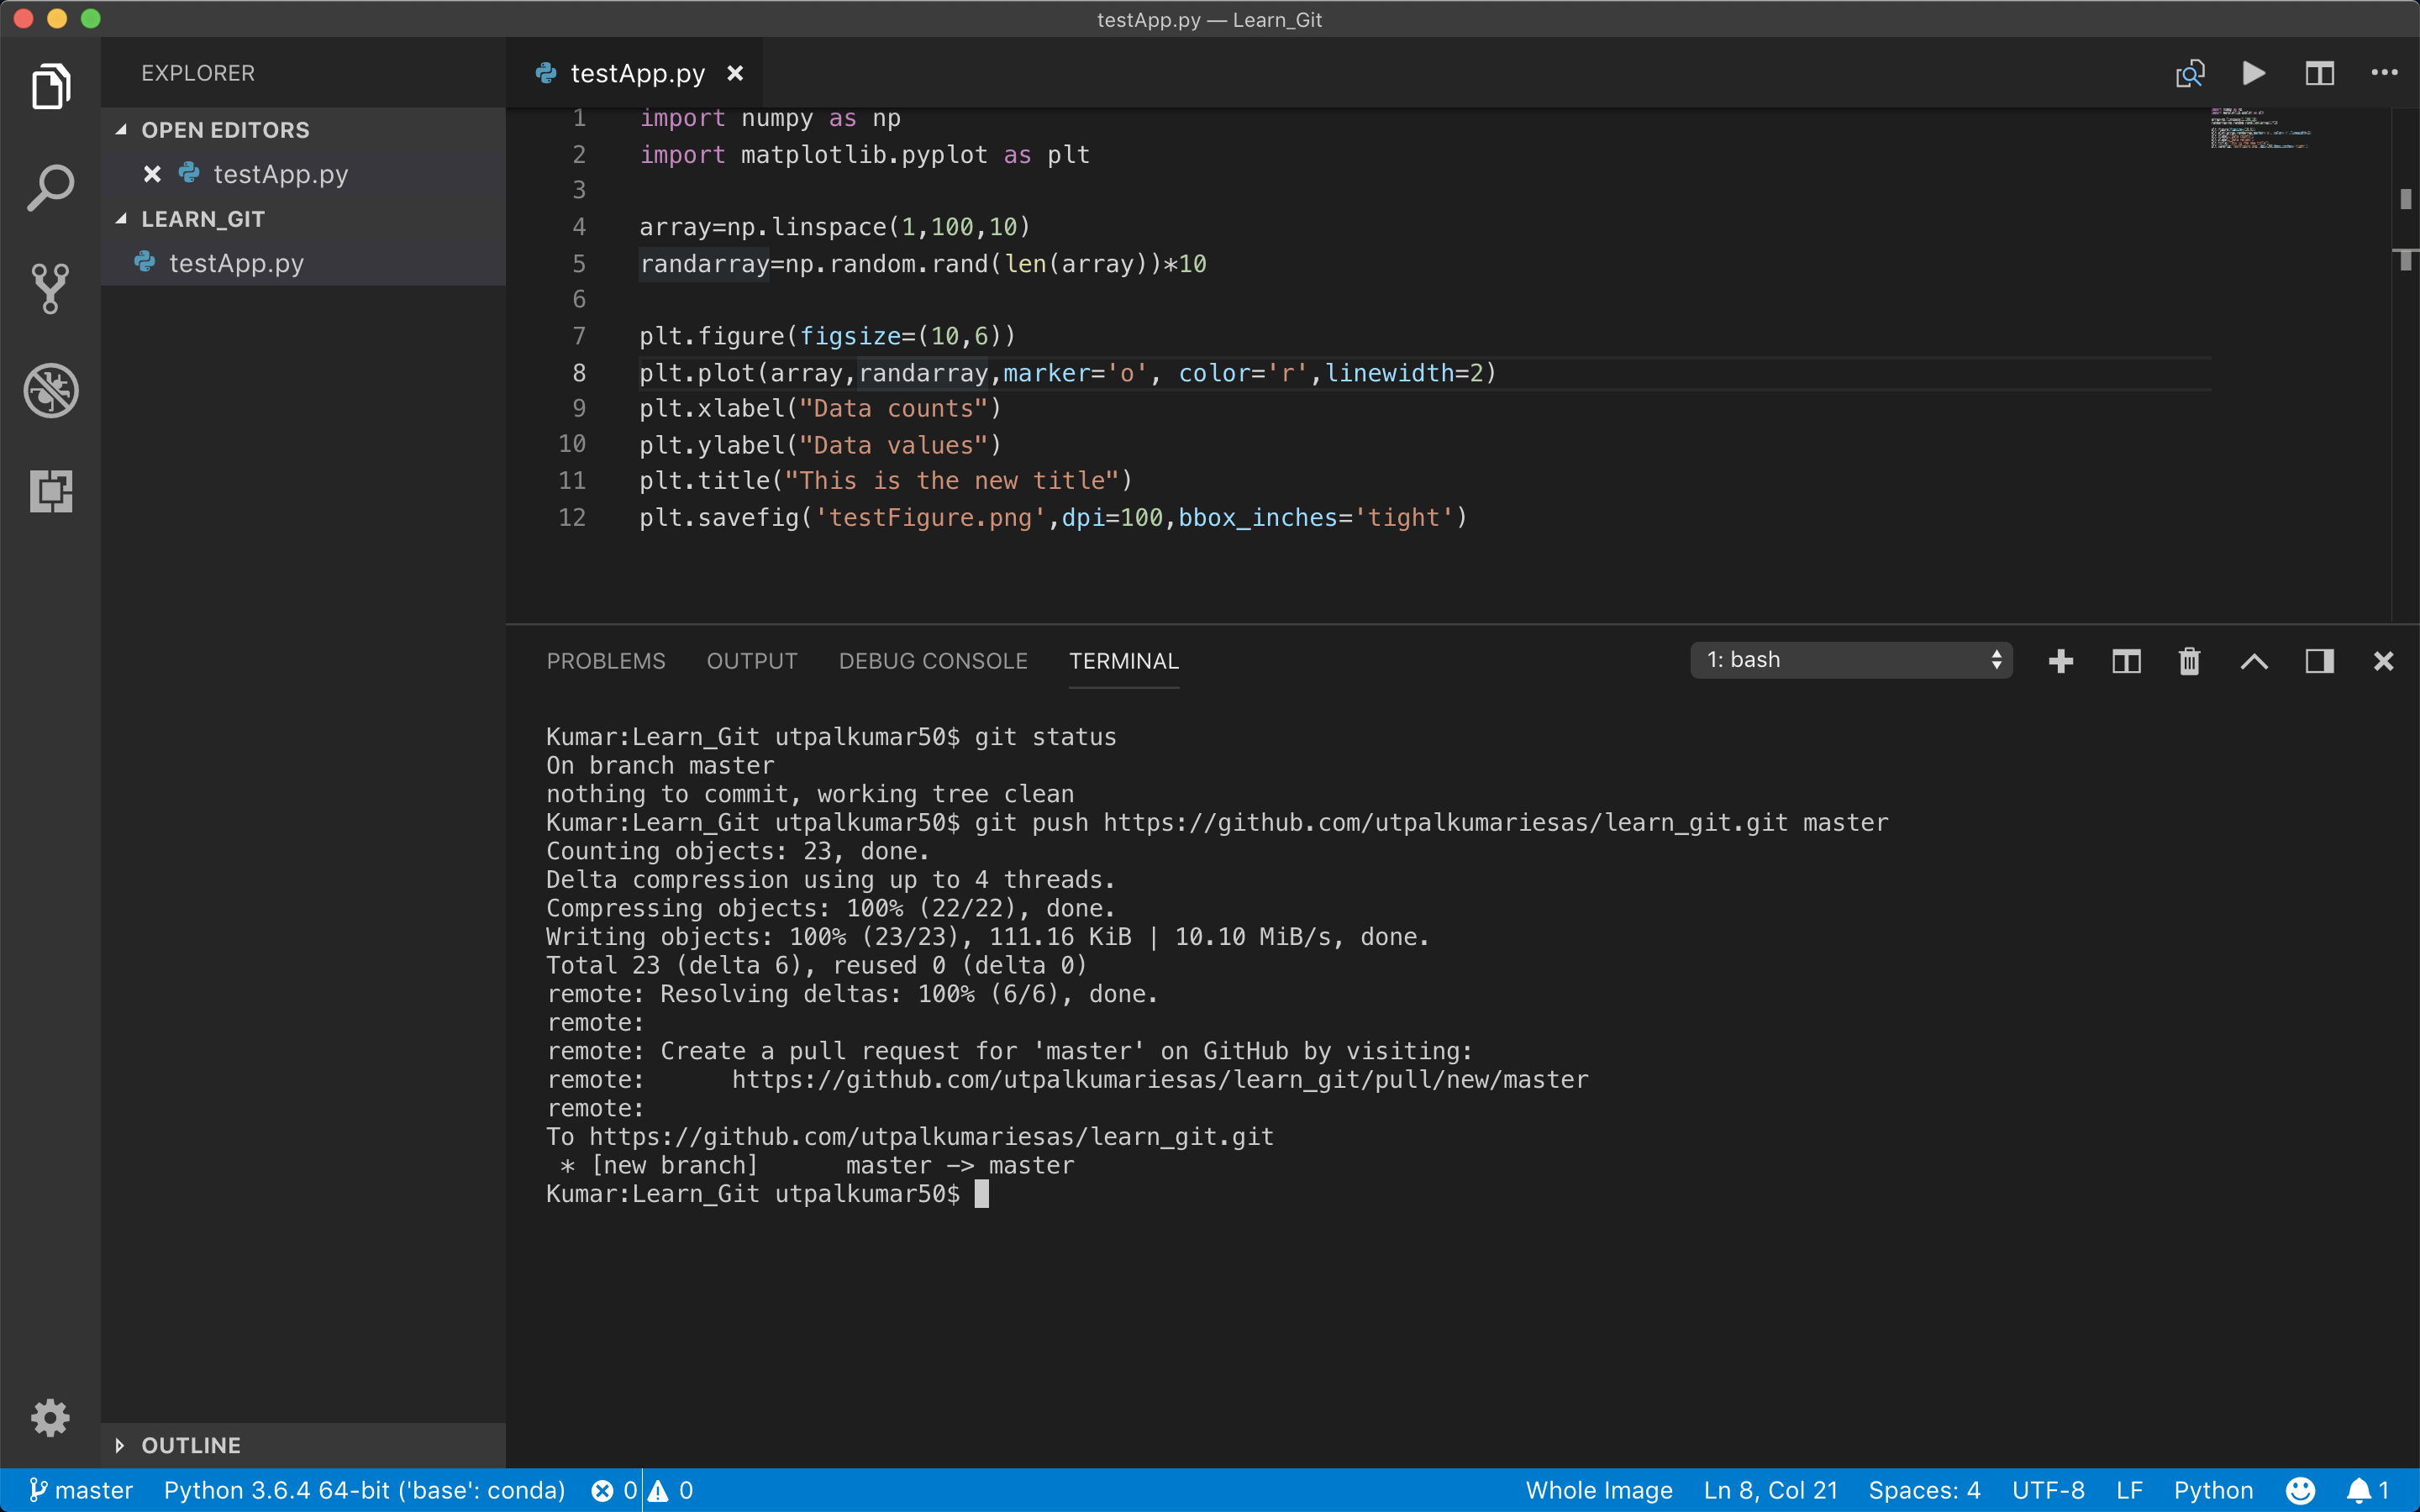
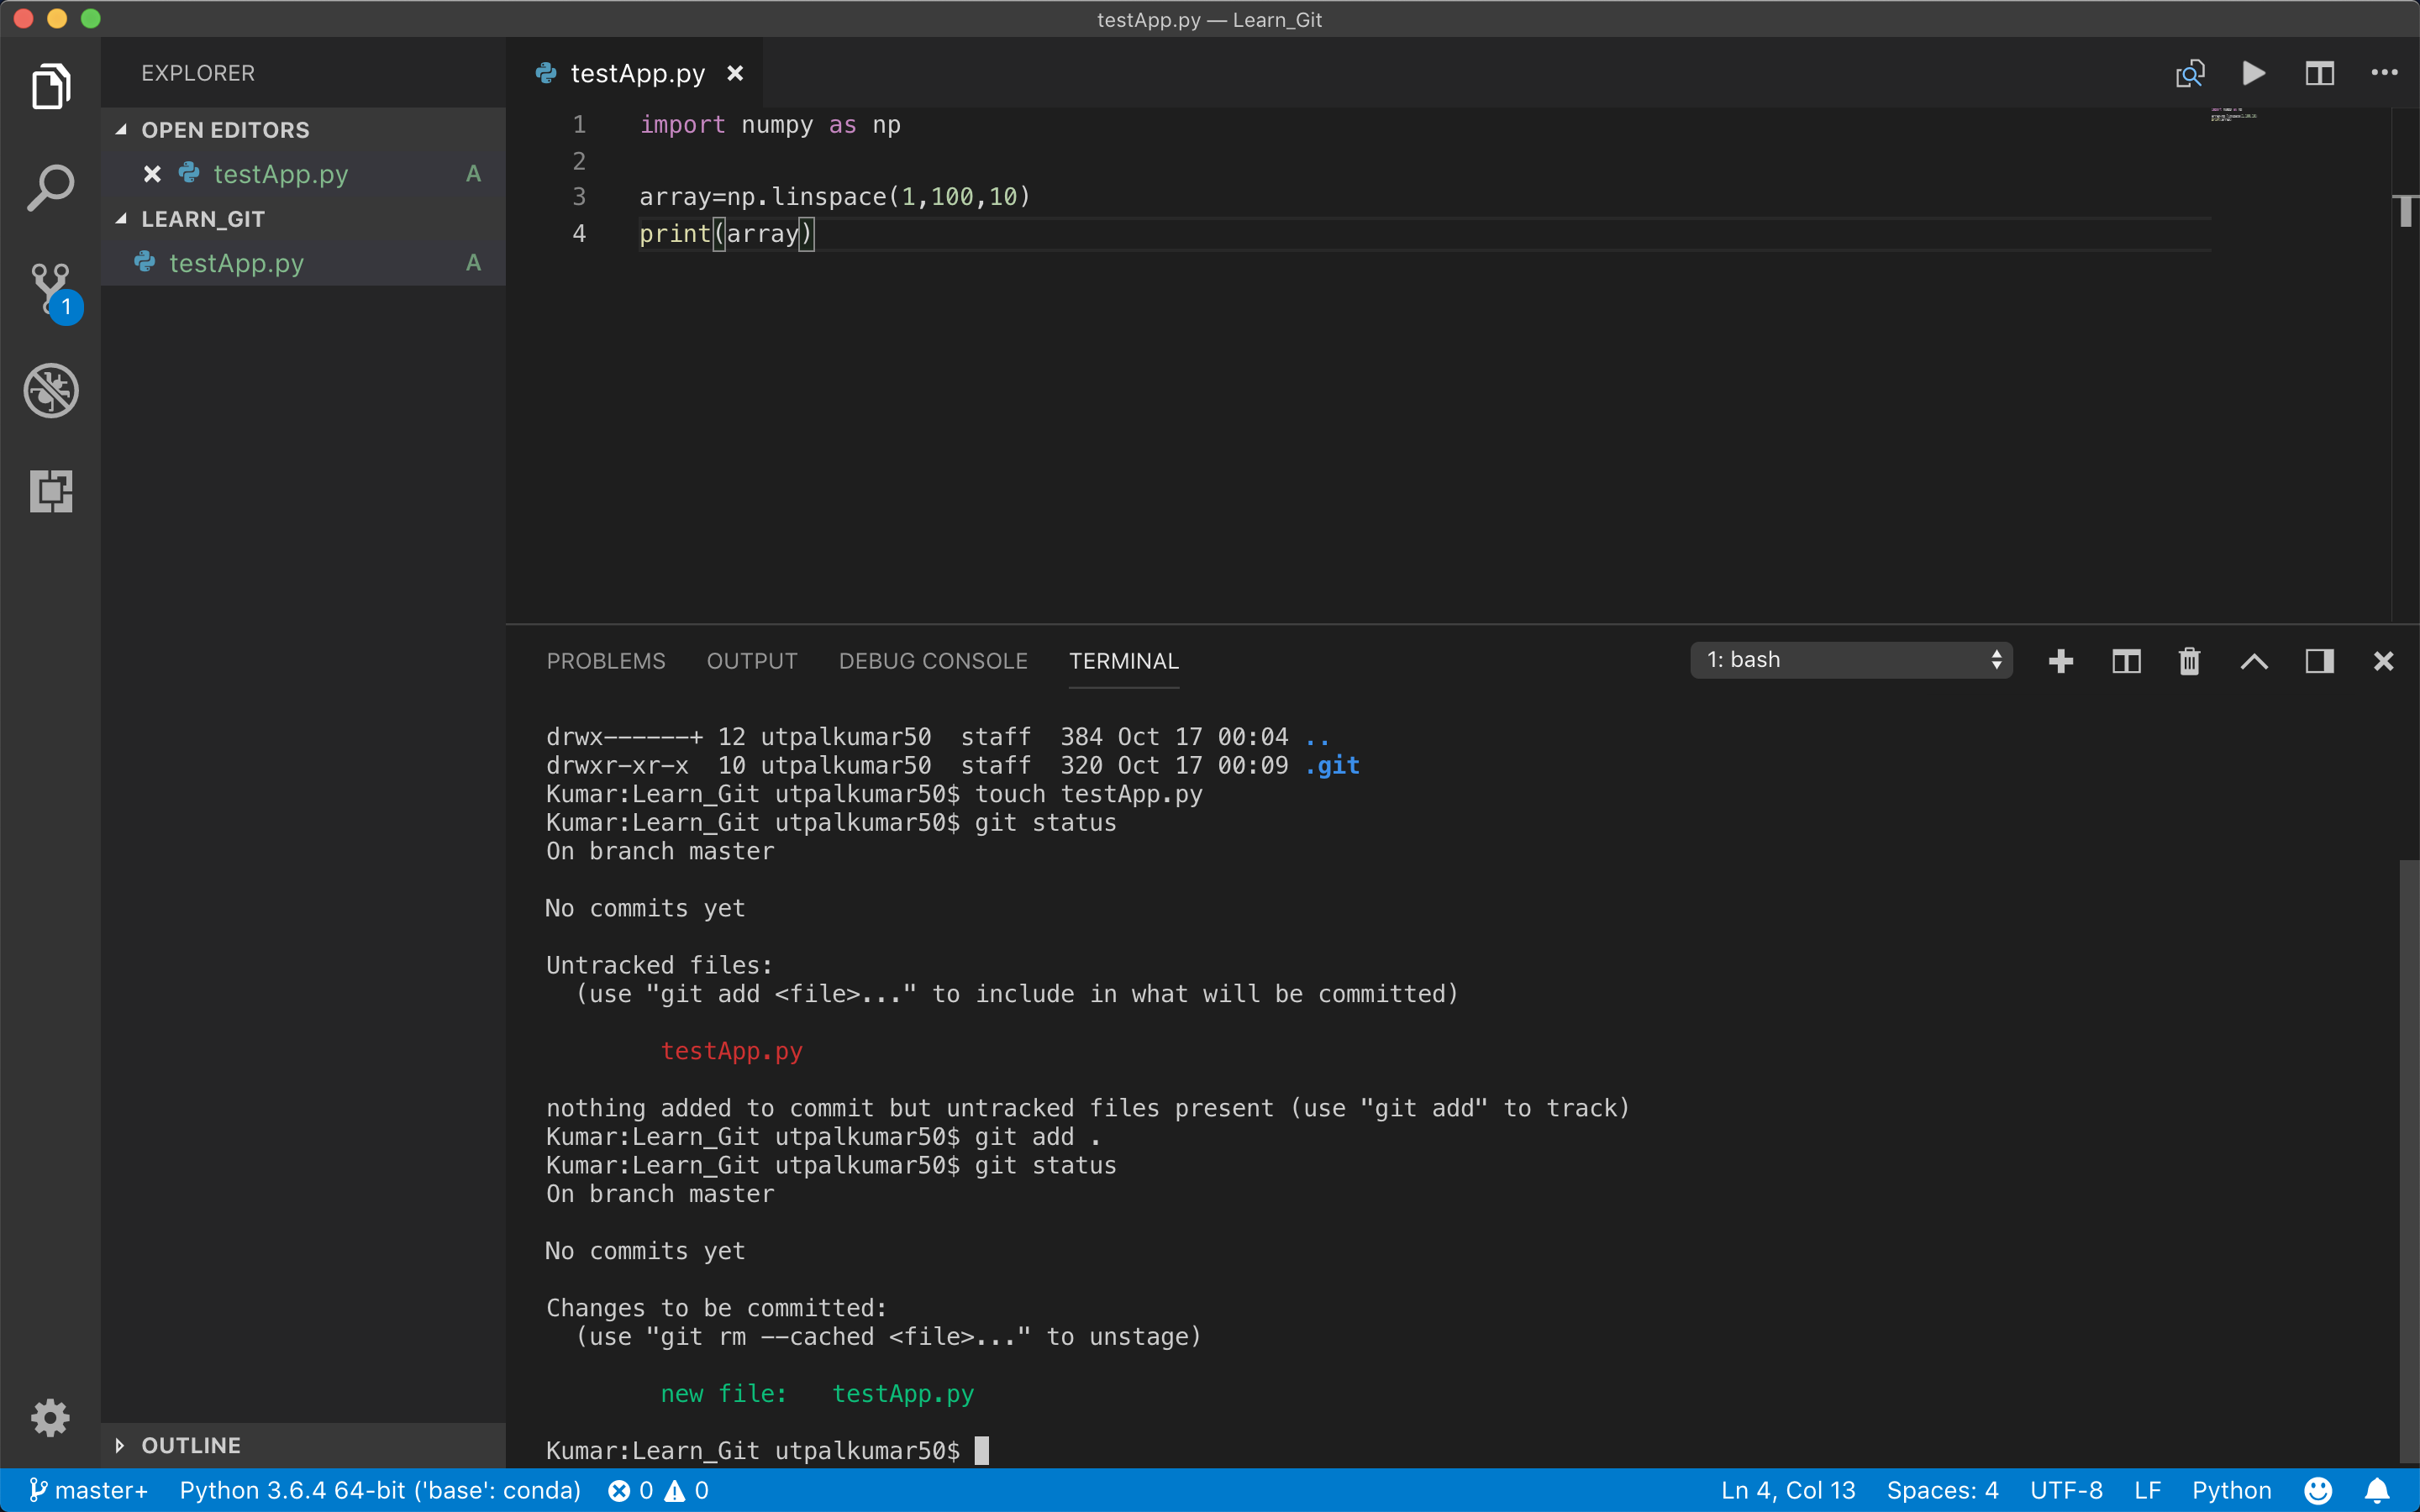
After initializing the Git in the working directory, we can create and modify any files in the current directory or the sub-directory. After finishing the code modification, we can check the status of the Git using the command
git status
It will show the status of files which are tracked and untracked. We can add all the files in the current directory and subsequent subdirectory for the tracking using the command:
git add .
Alternatively, we can also add each file separately by their names.
Sometimes, we don’t wanna add some files for committing to track using the Git but by mistake, it gets added. To remove those files, we can use the command:
git rm --cached filename
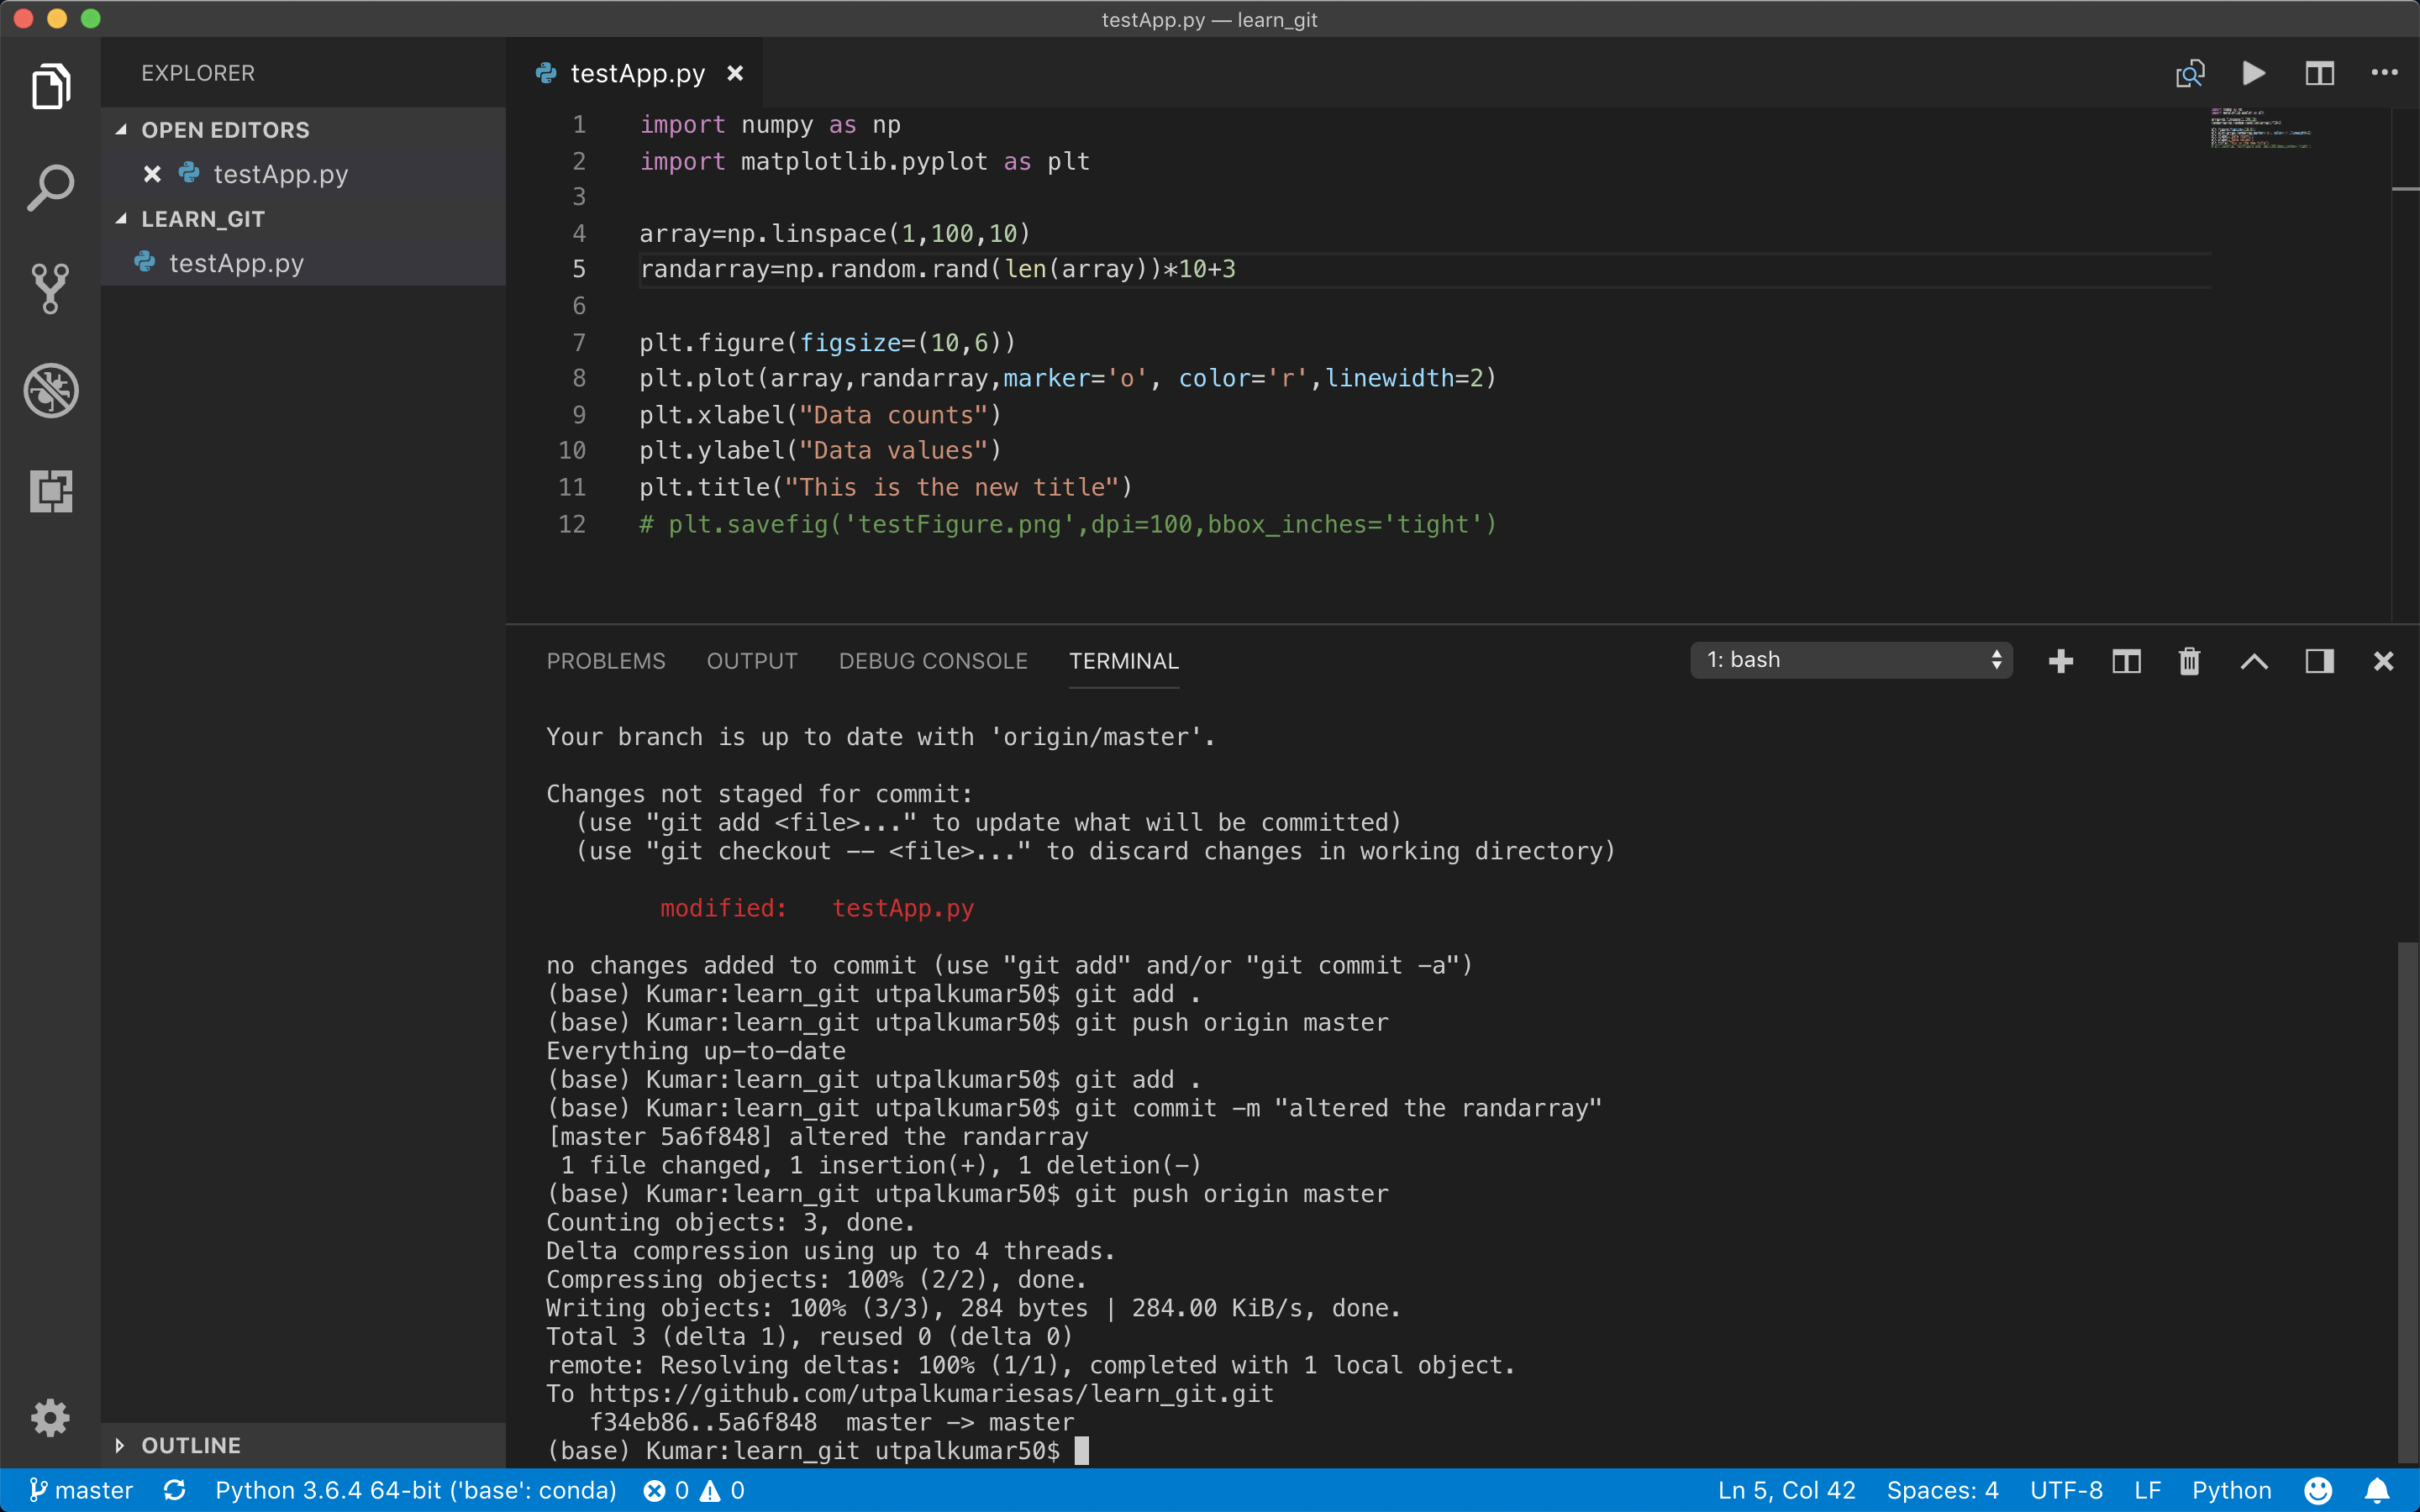
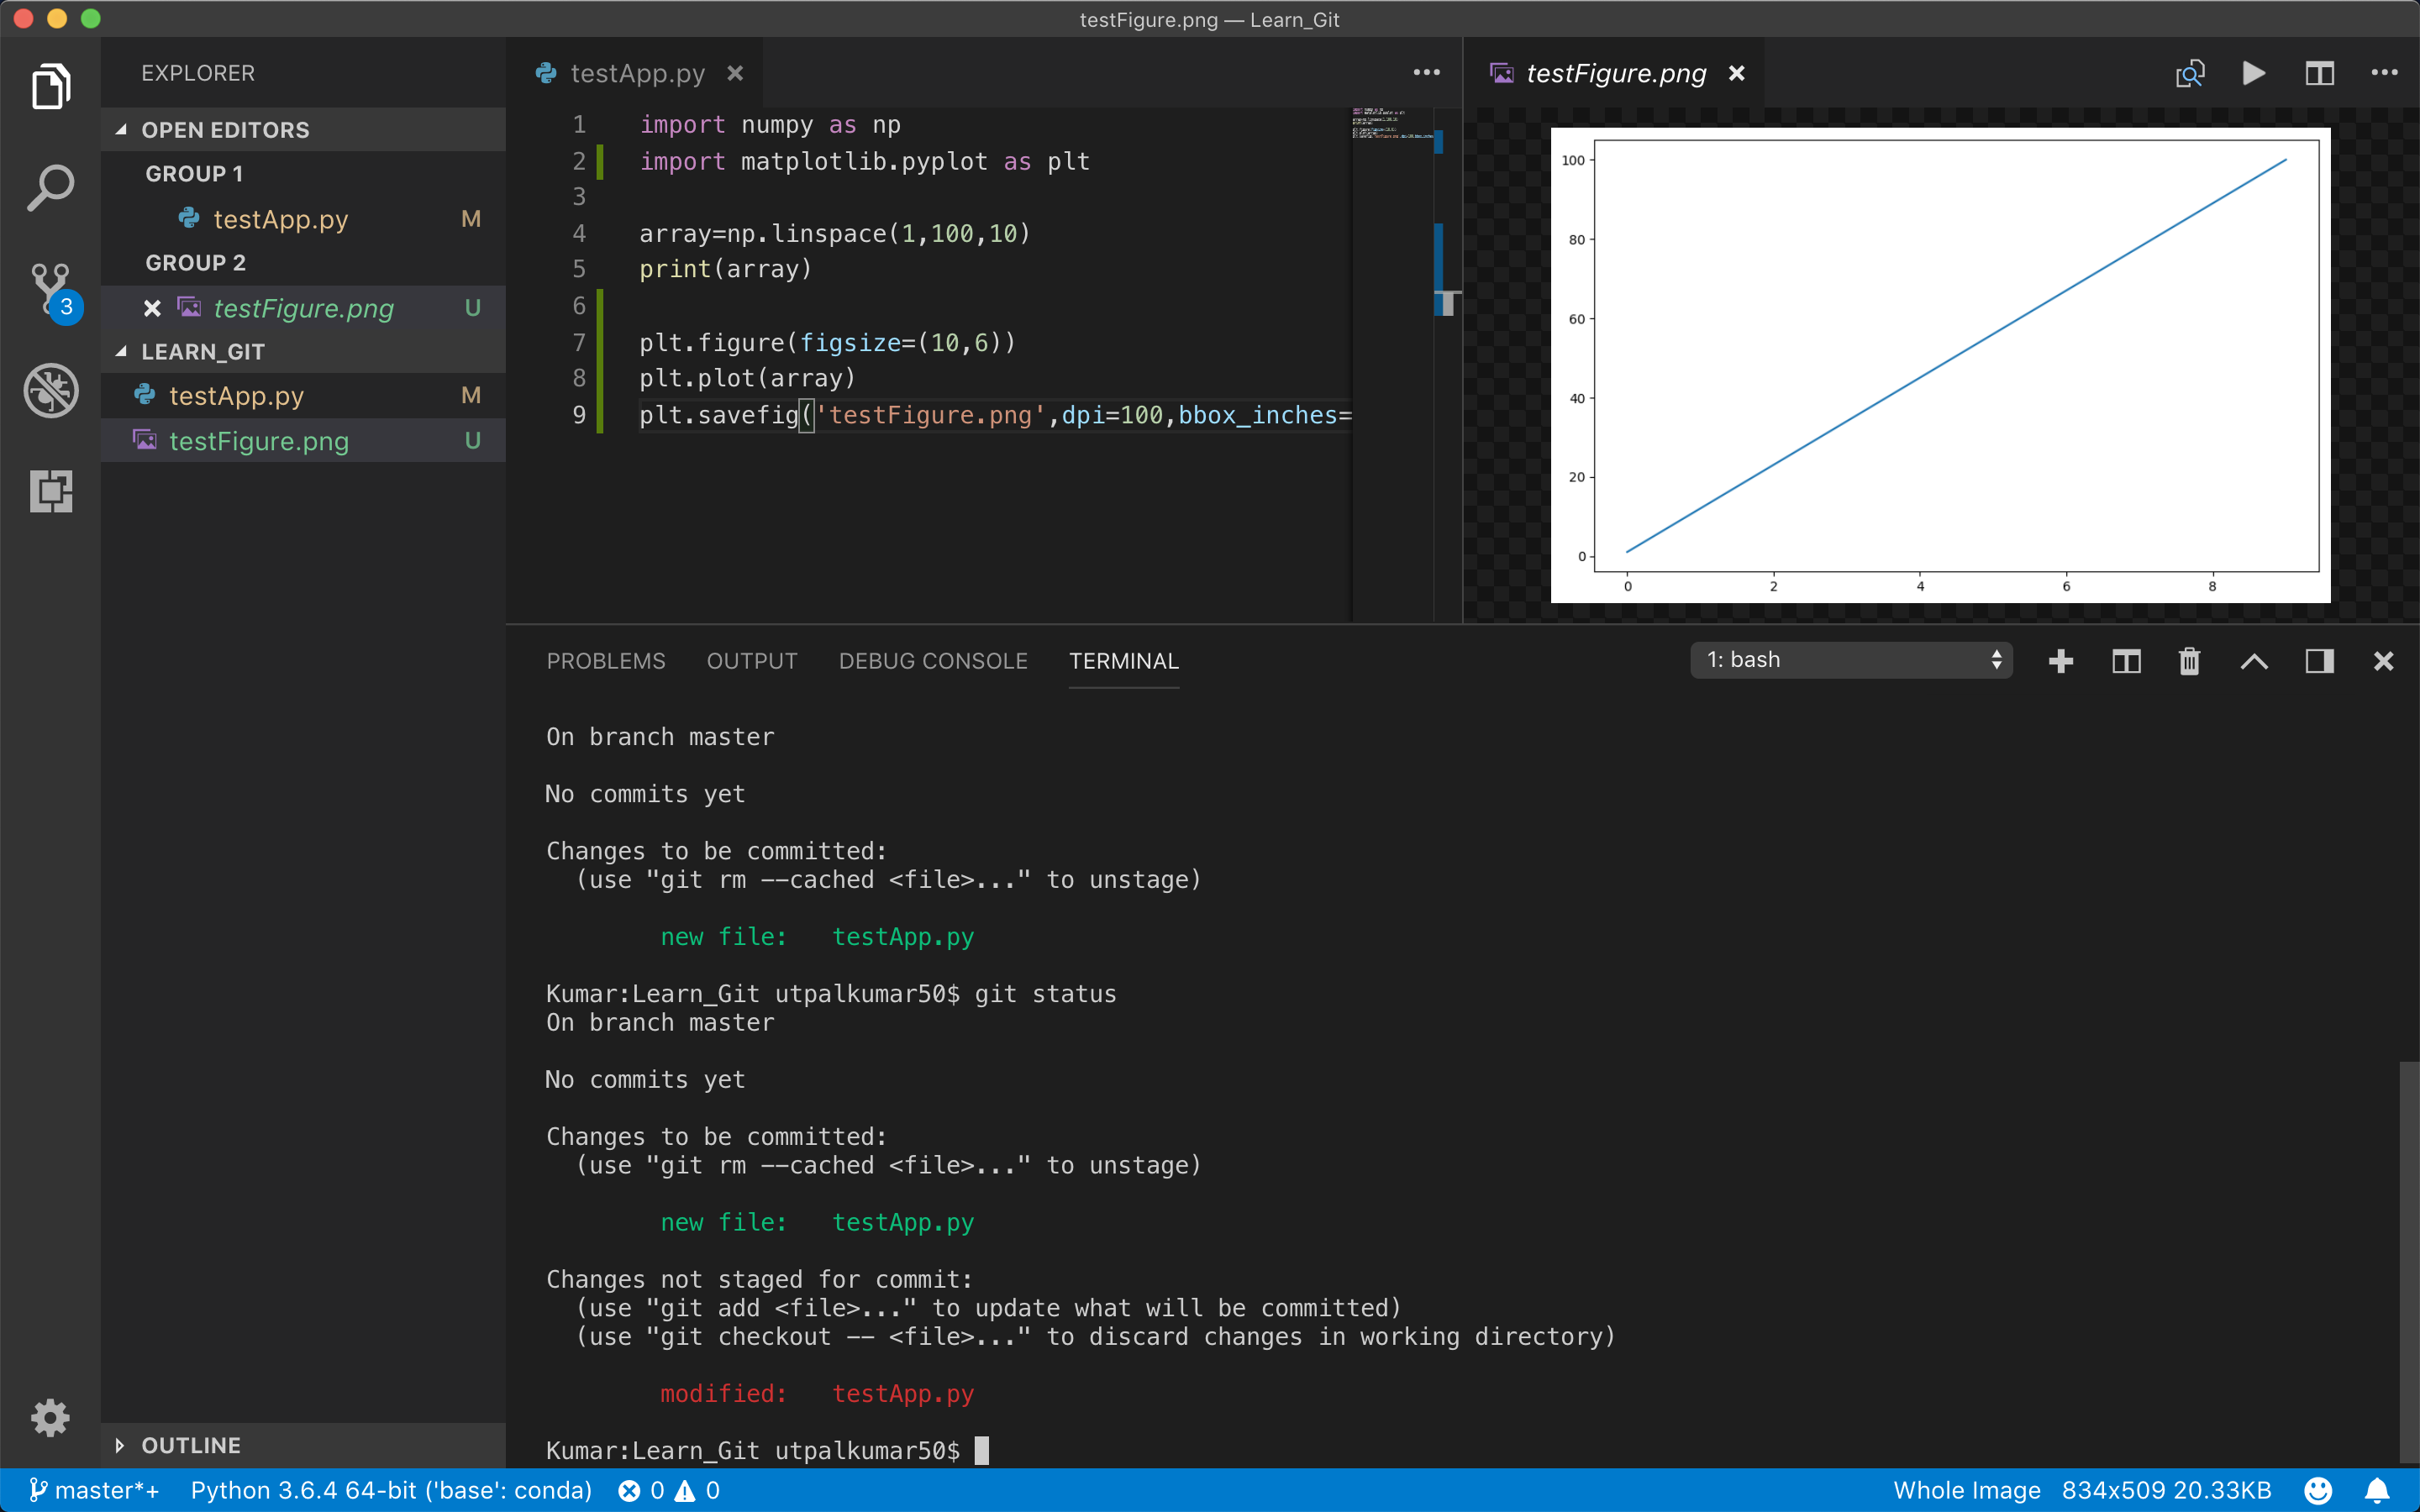
If we modify the file “testApp.py” and then run the command
git status
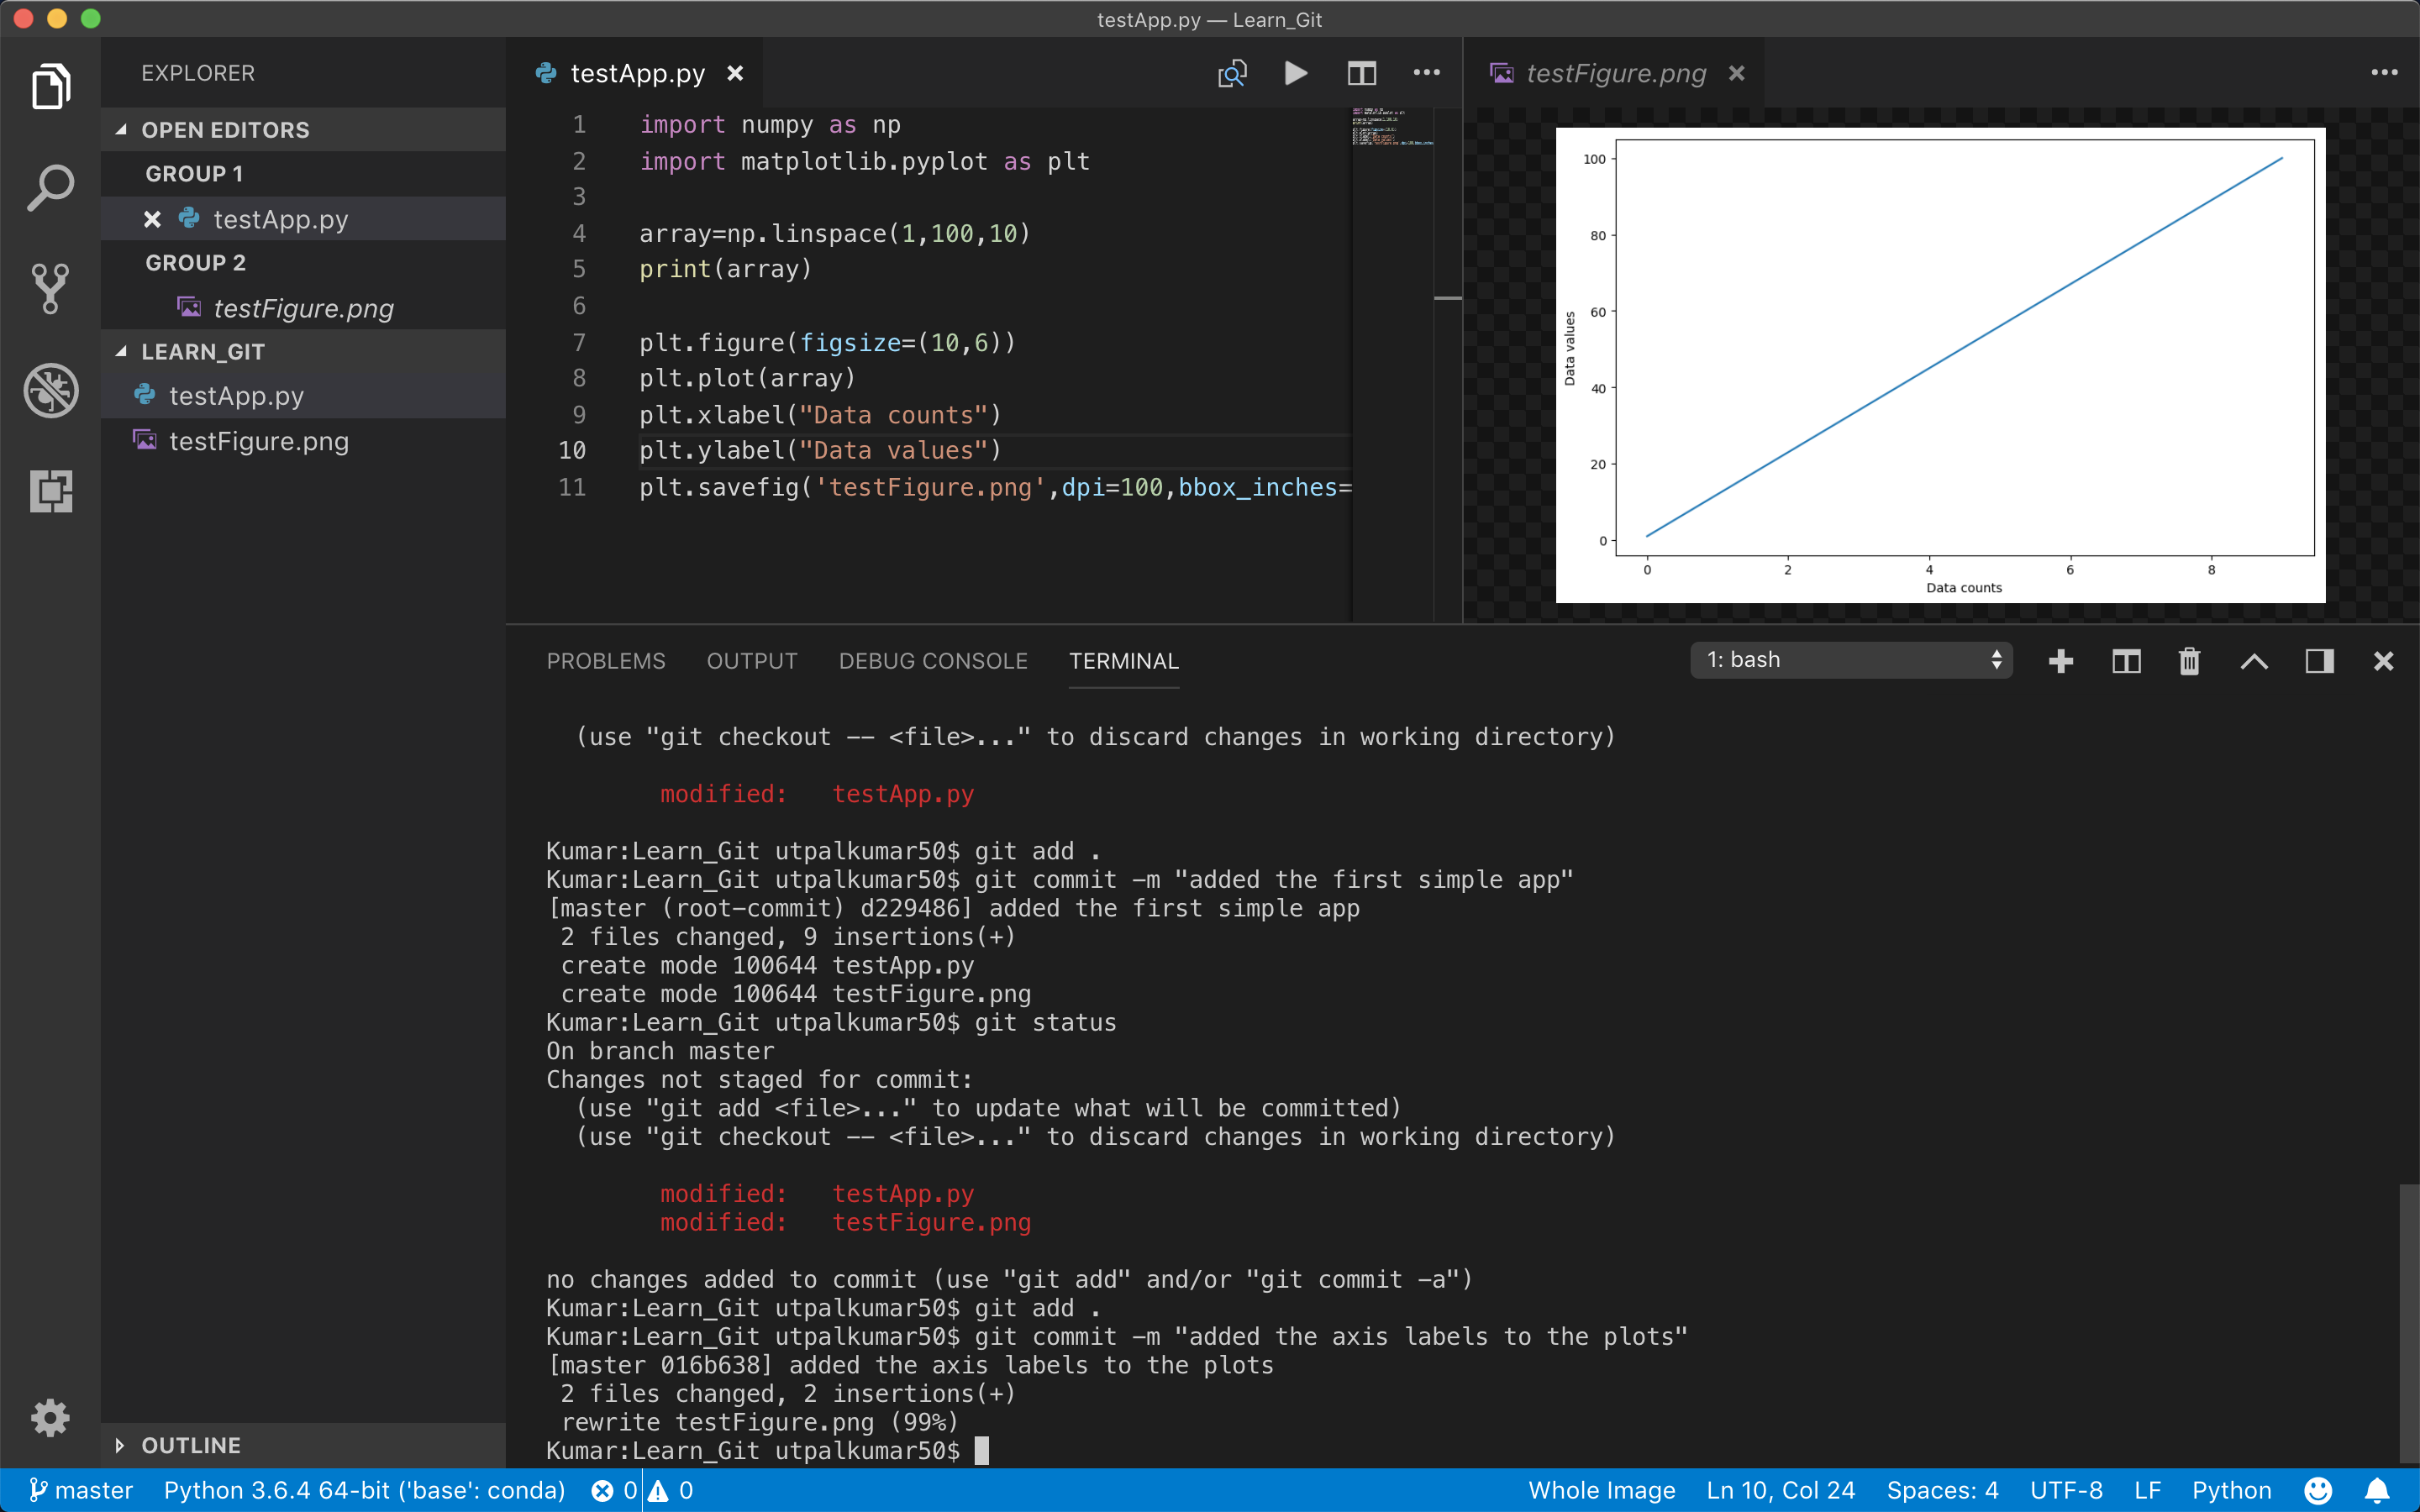
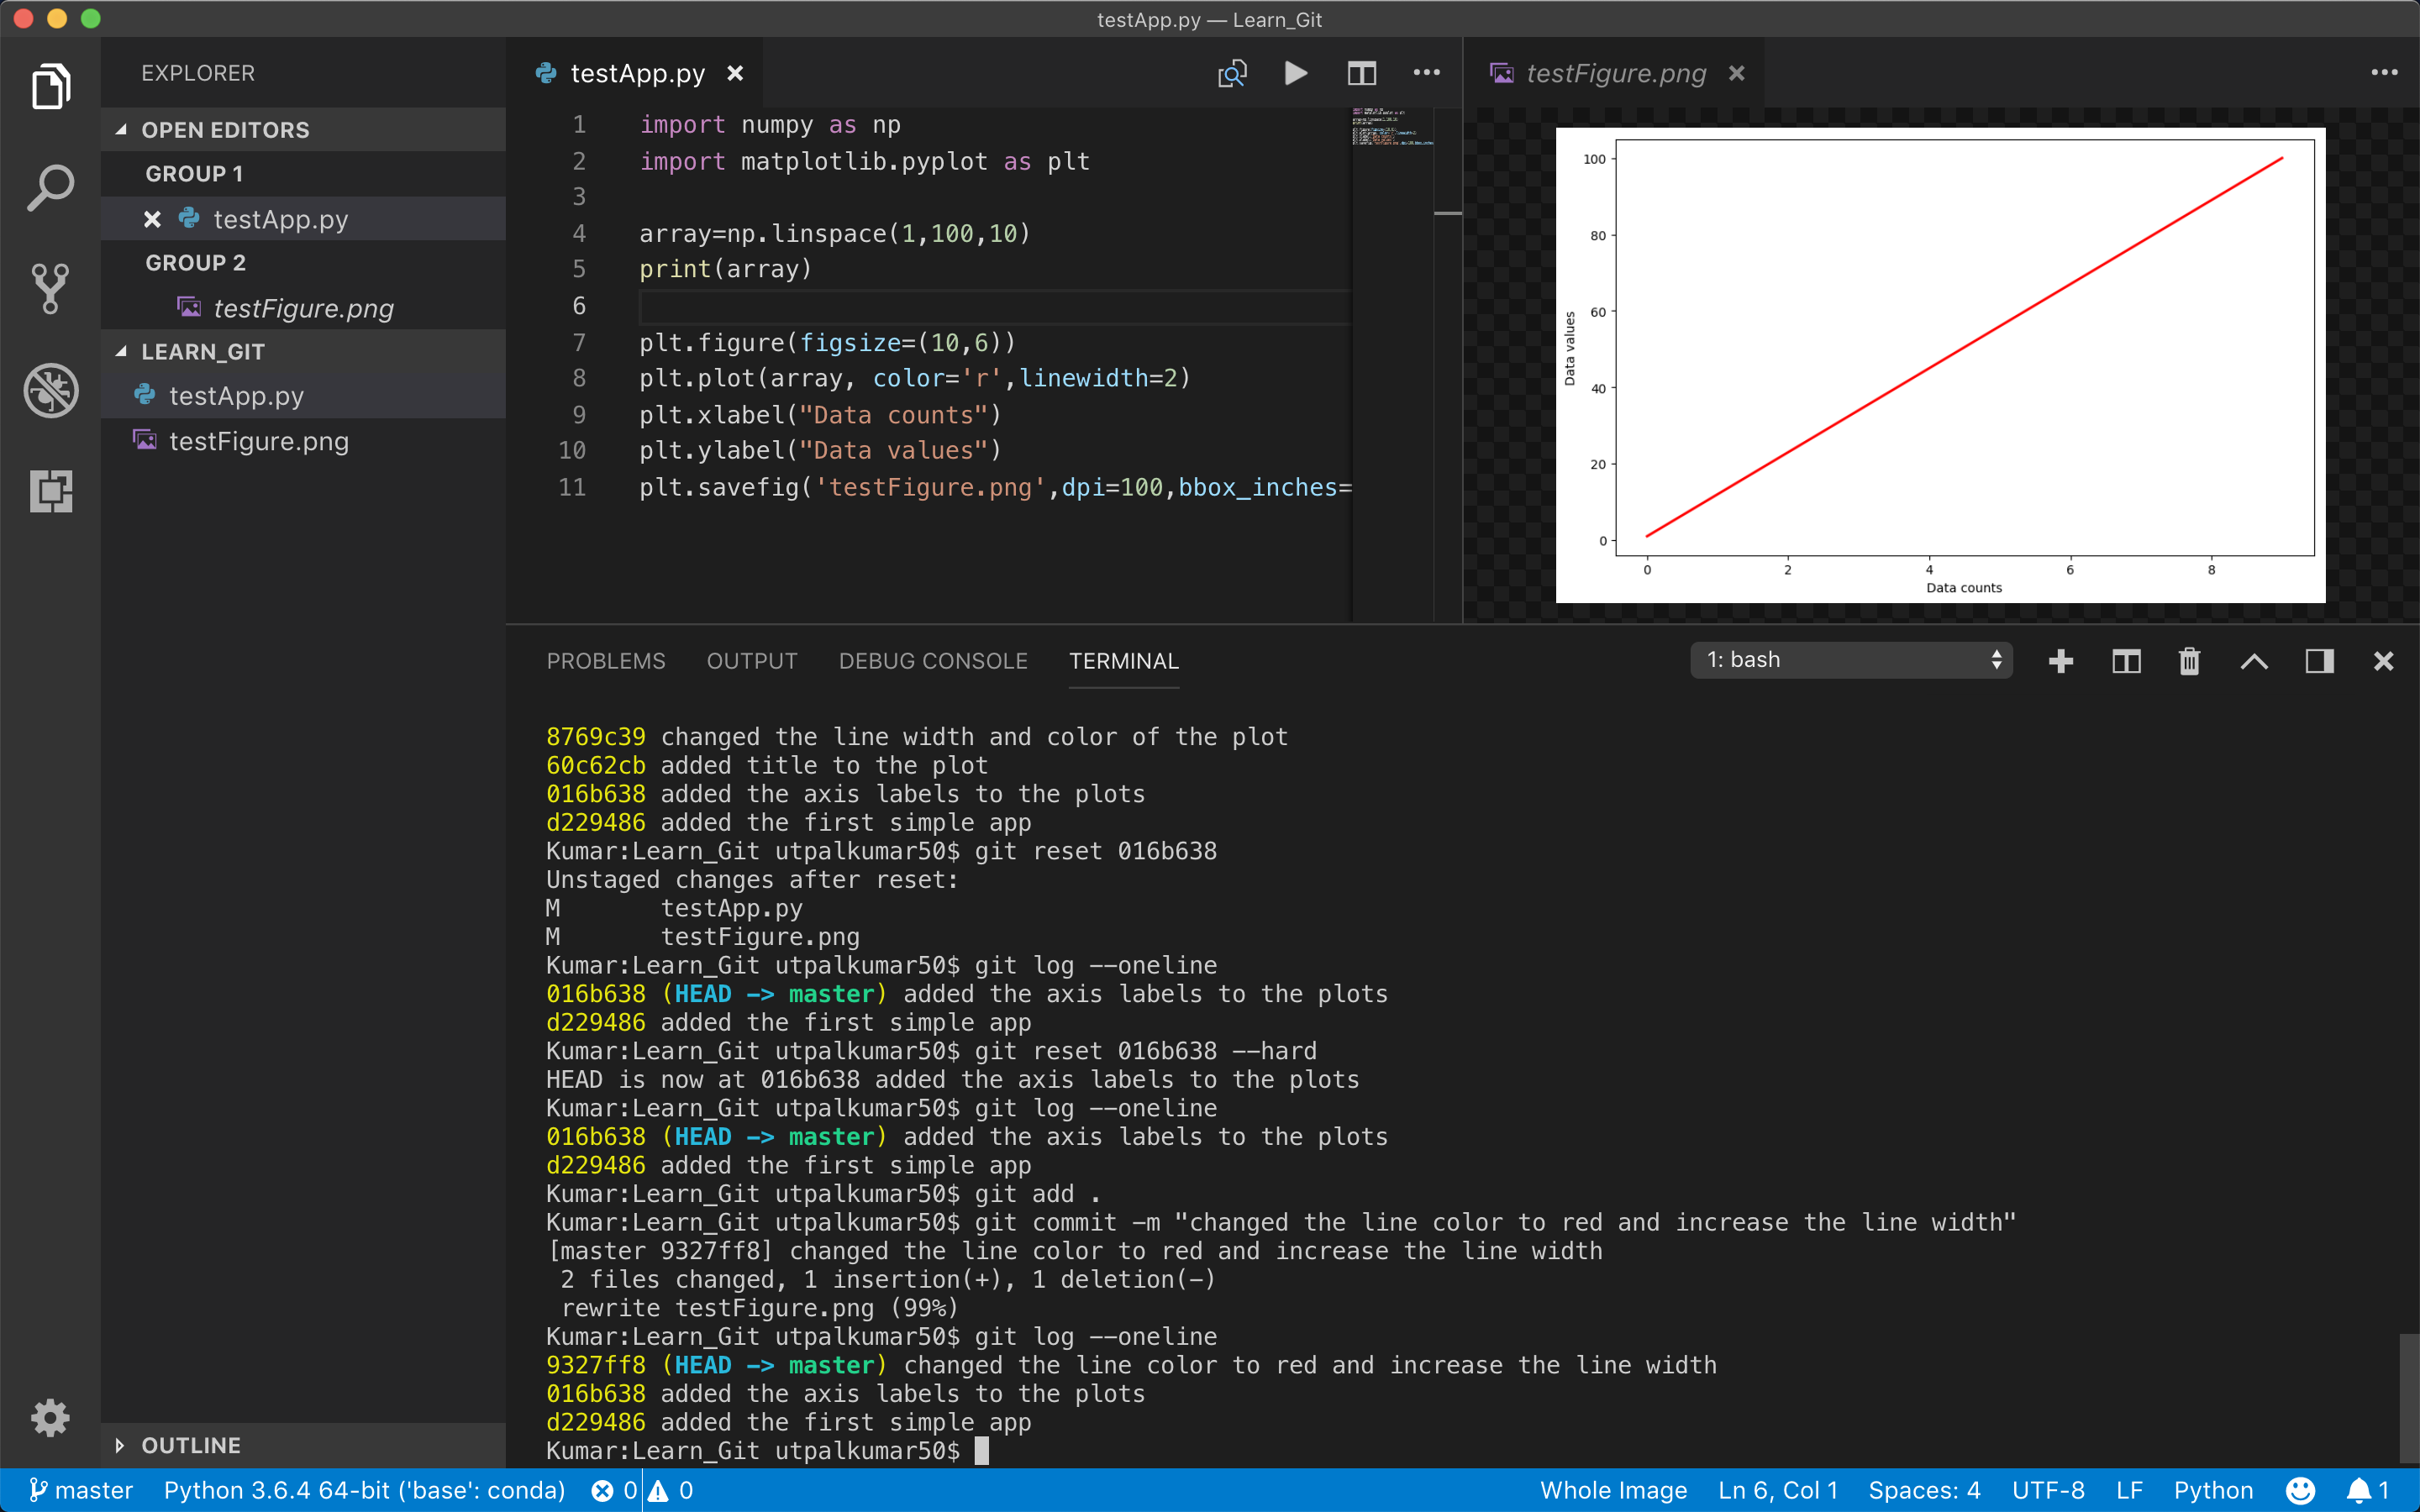
Making Commits
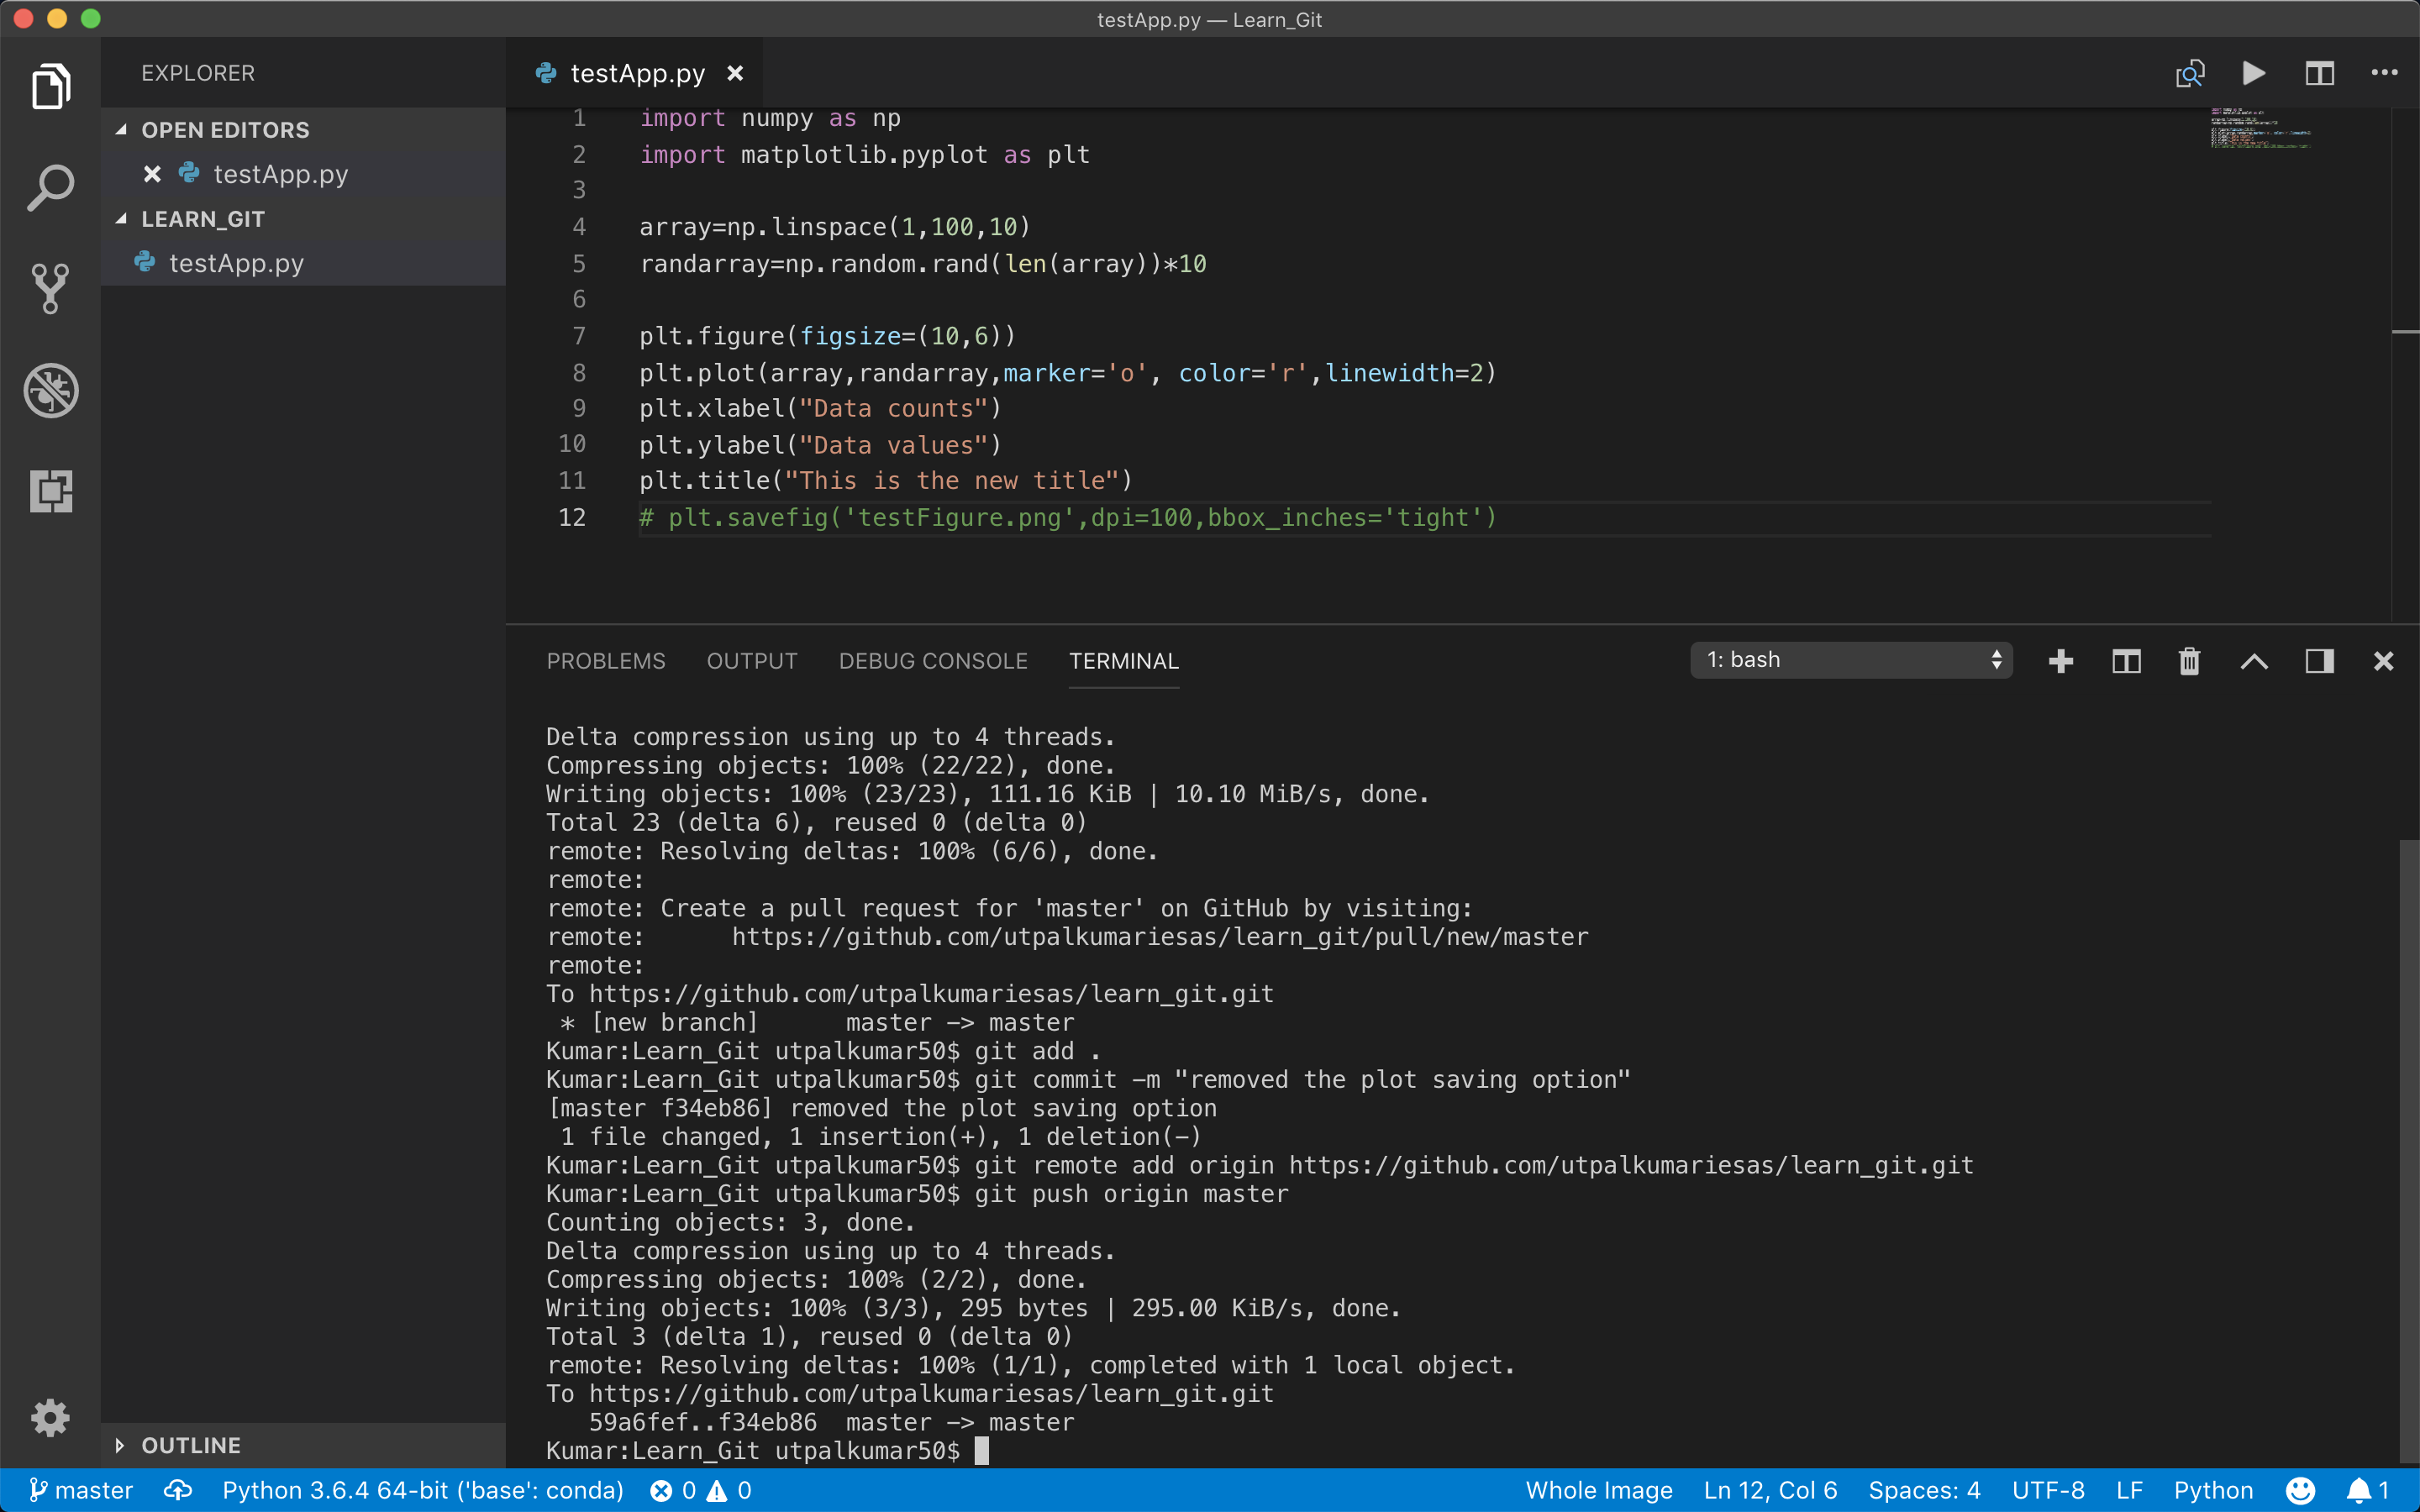
In simple words, a commit is a safe-point, a snapshot in time of our code at a particular point.
git commit -m "some message"
Please make sure to add meaningful messages to the commits so that at some point if we wanna go back to the previous version, we can figure that out easily using the message.
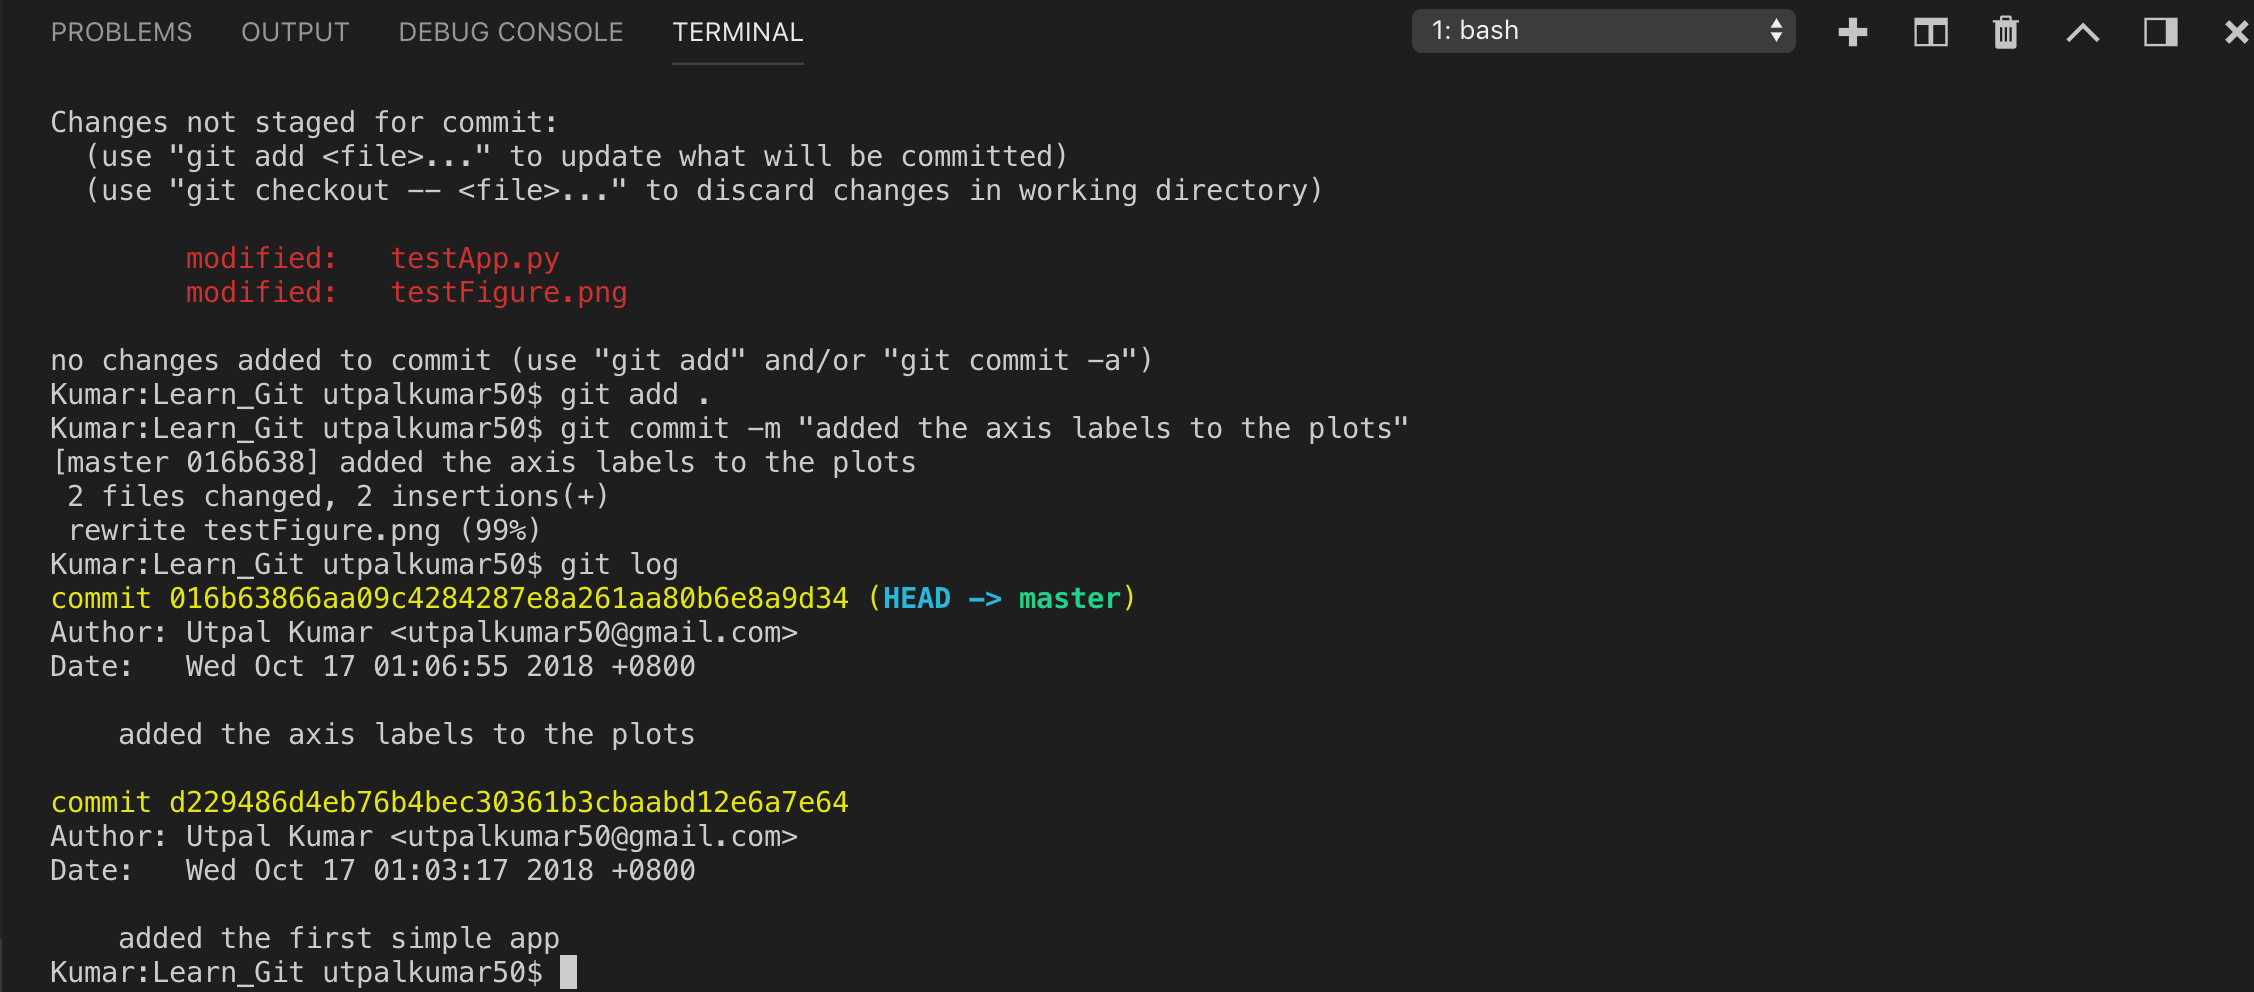
If we wanna see the history of all our commits we can use the command
git log
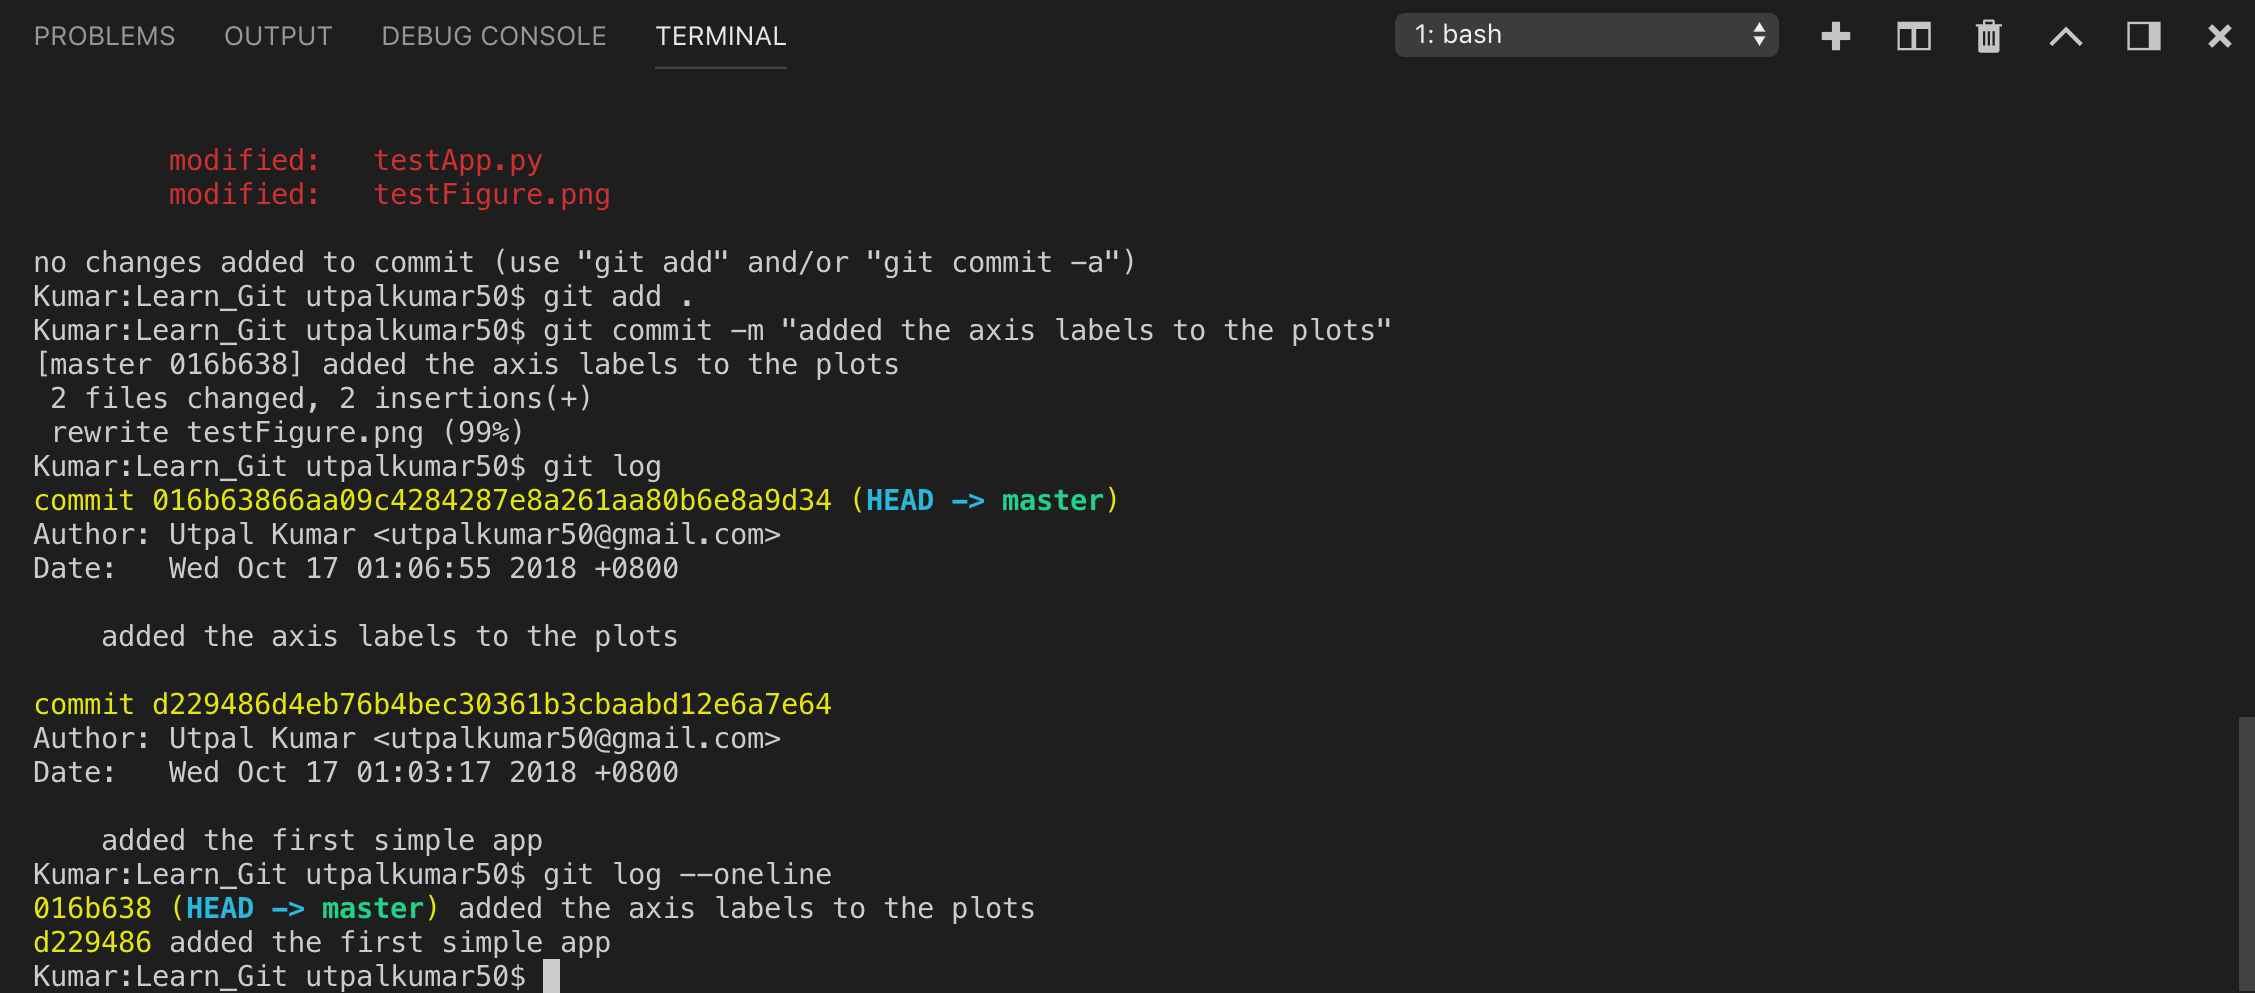
Sometimes, if we have a lot of commits, we don’t wanna print everything out. So, we can condense the output of the log using the command:
git log --oneline
Undoing stuff
Undoing the mistake of one version is the primary goal of using Git. Let’s see how we can execute that. We can rewind the commit and go back to the previous version. We can do that by three ways in the order of increasing risk:
- Checkout commit: Very safe option. Best option to go back to the past version without getting rid of any other versions.
- Revert commit: Apparently, delete some unrequired commits from the history.
- Reset commit: We need to be very sure before we do this. This will permanently delete all the commits after the point we move to.
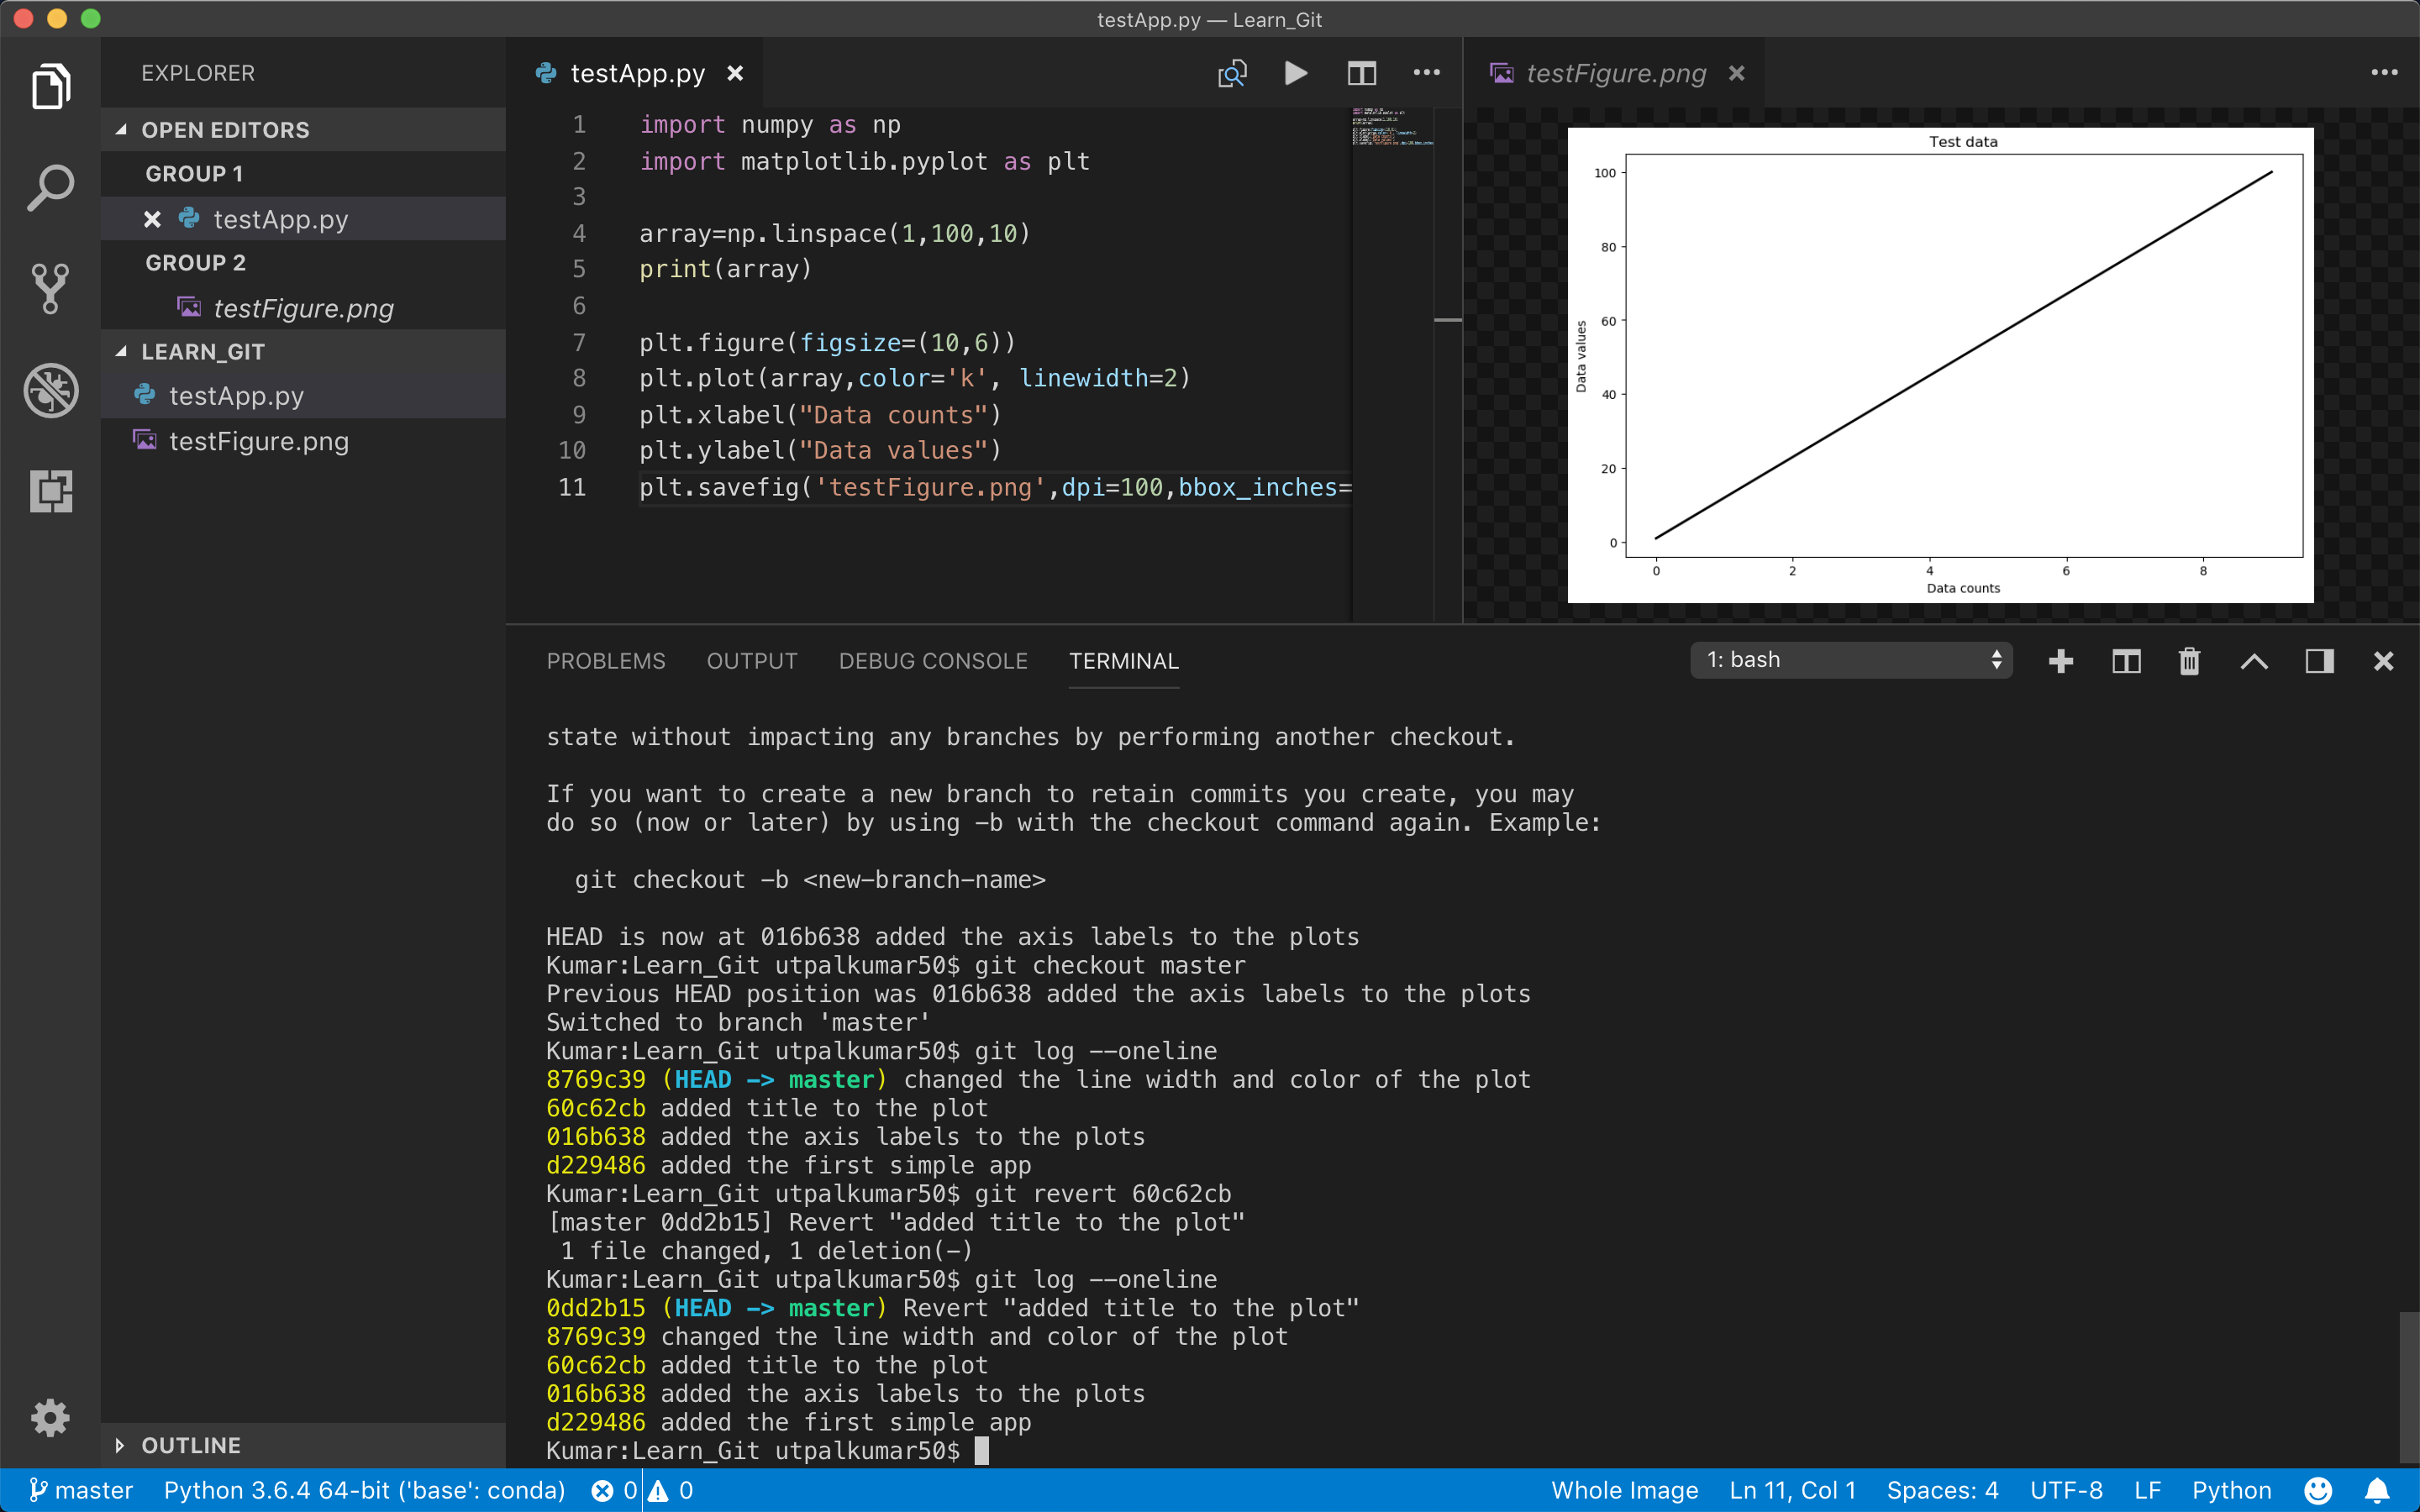
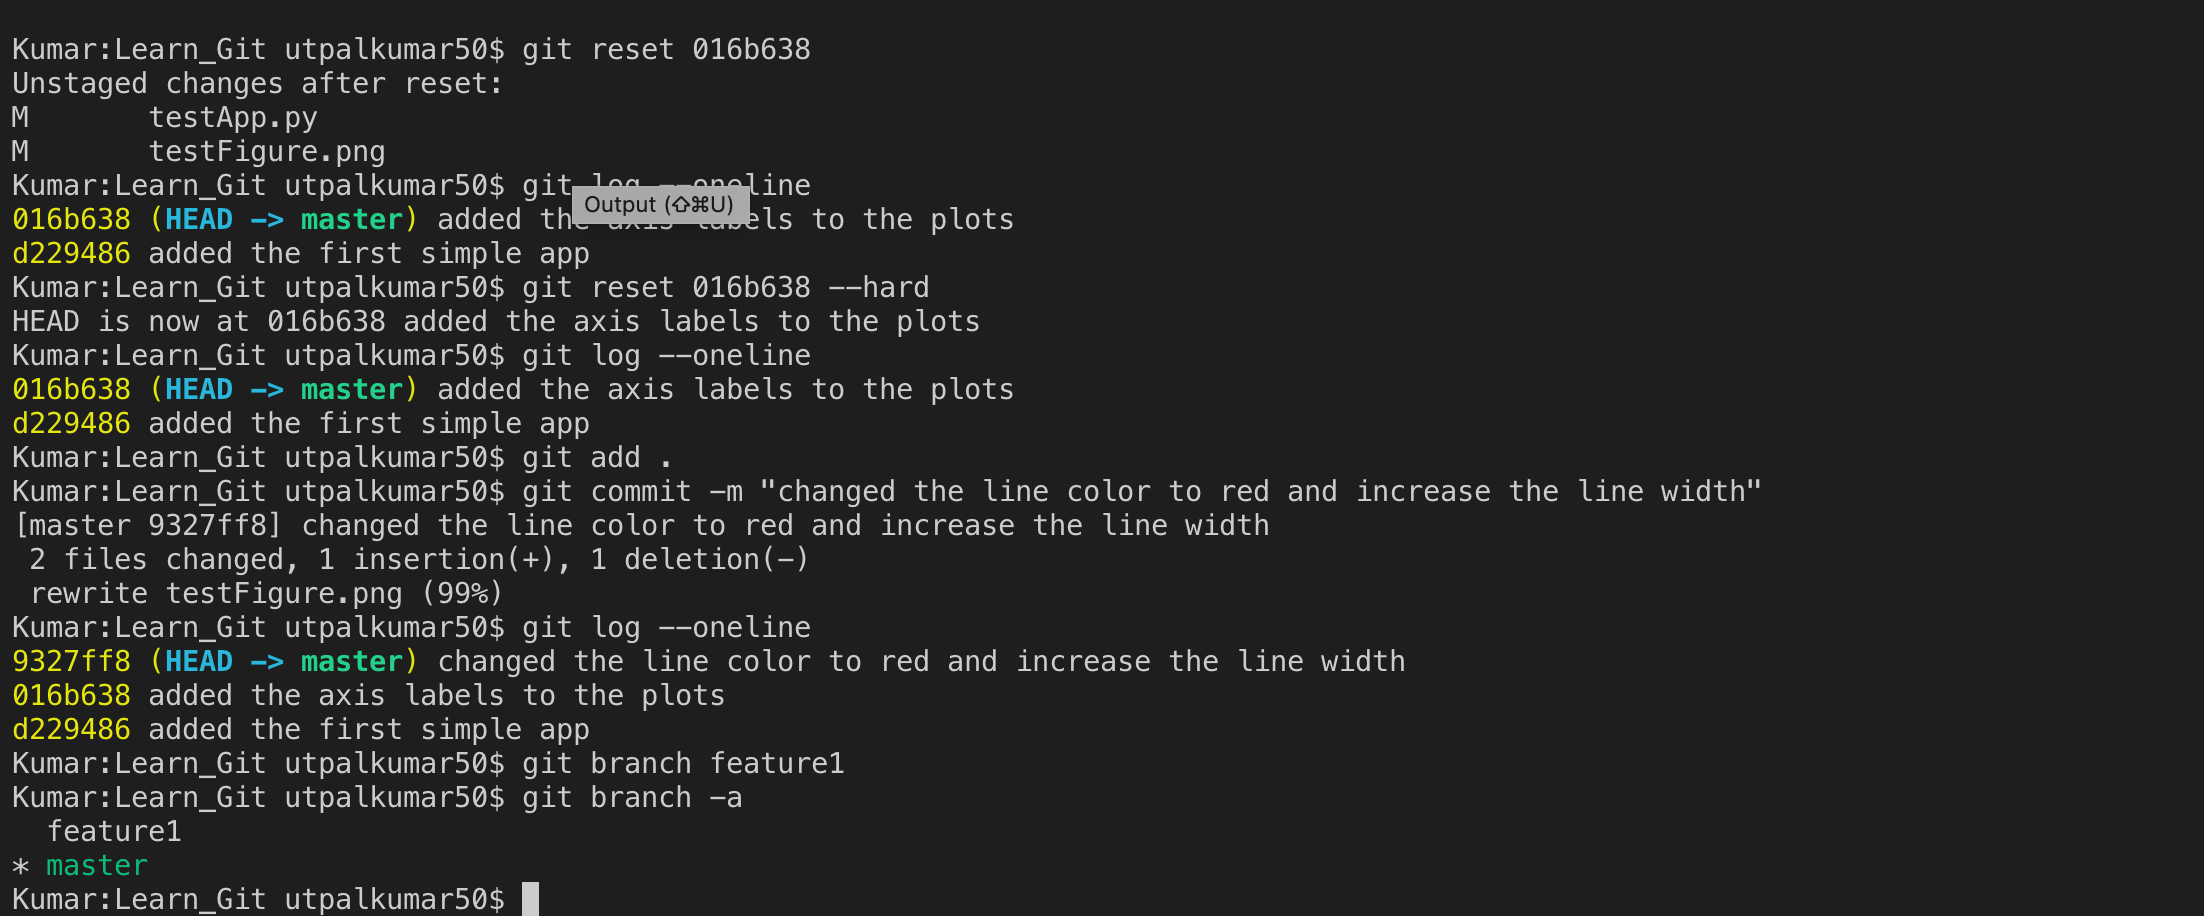
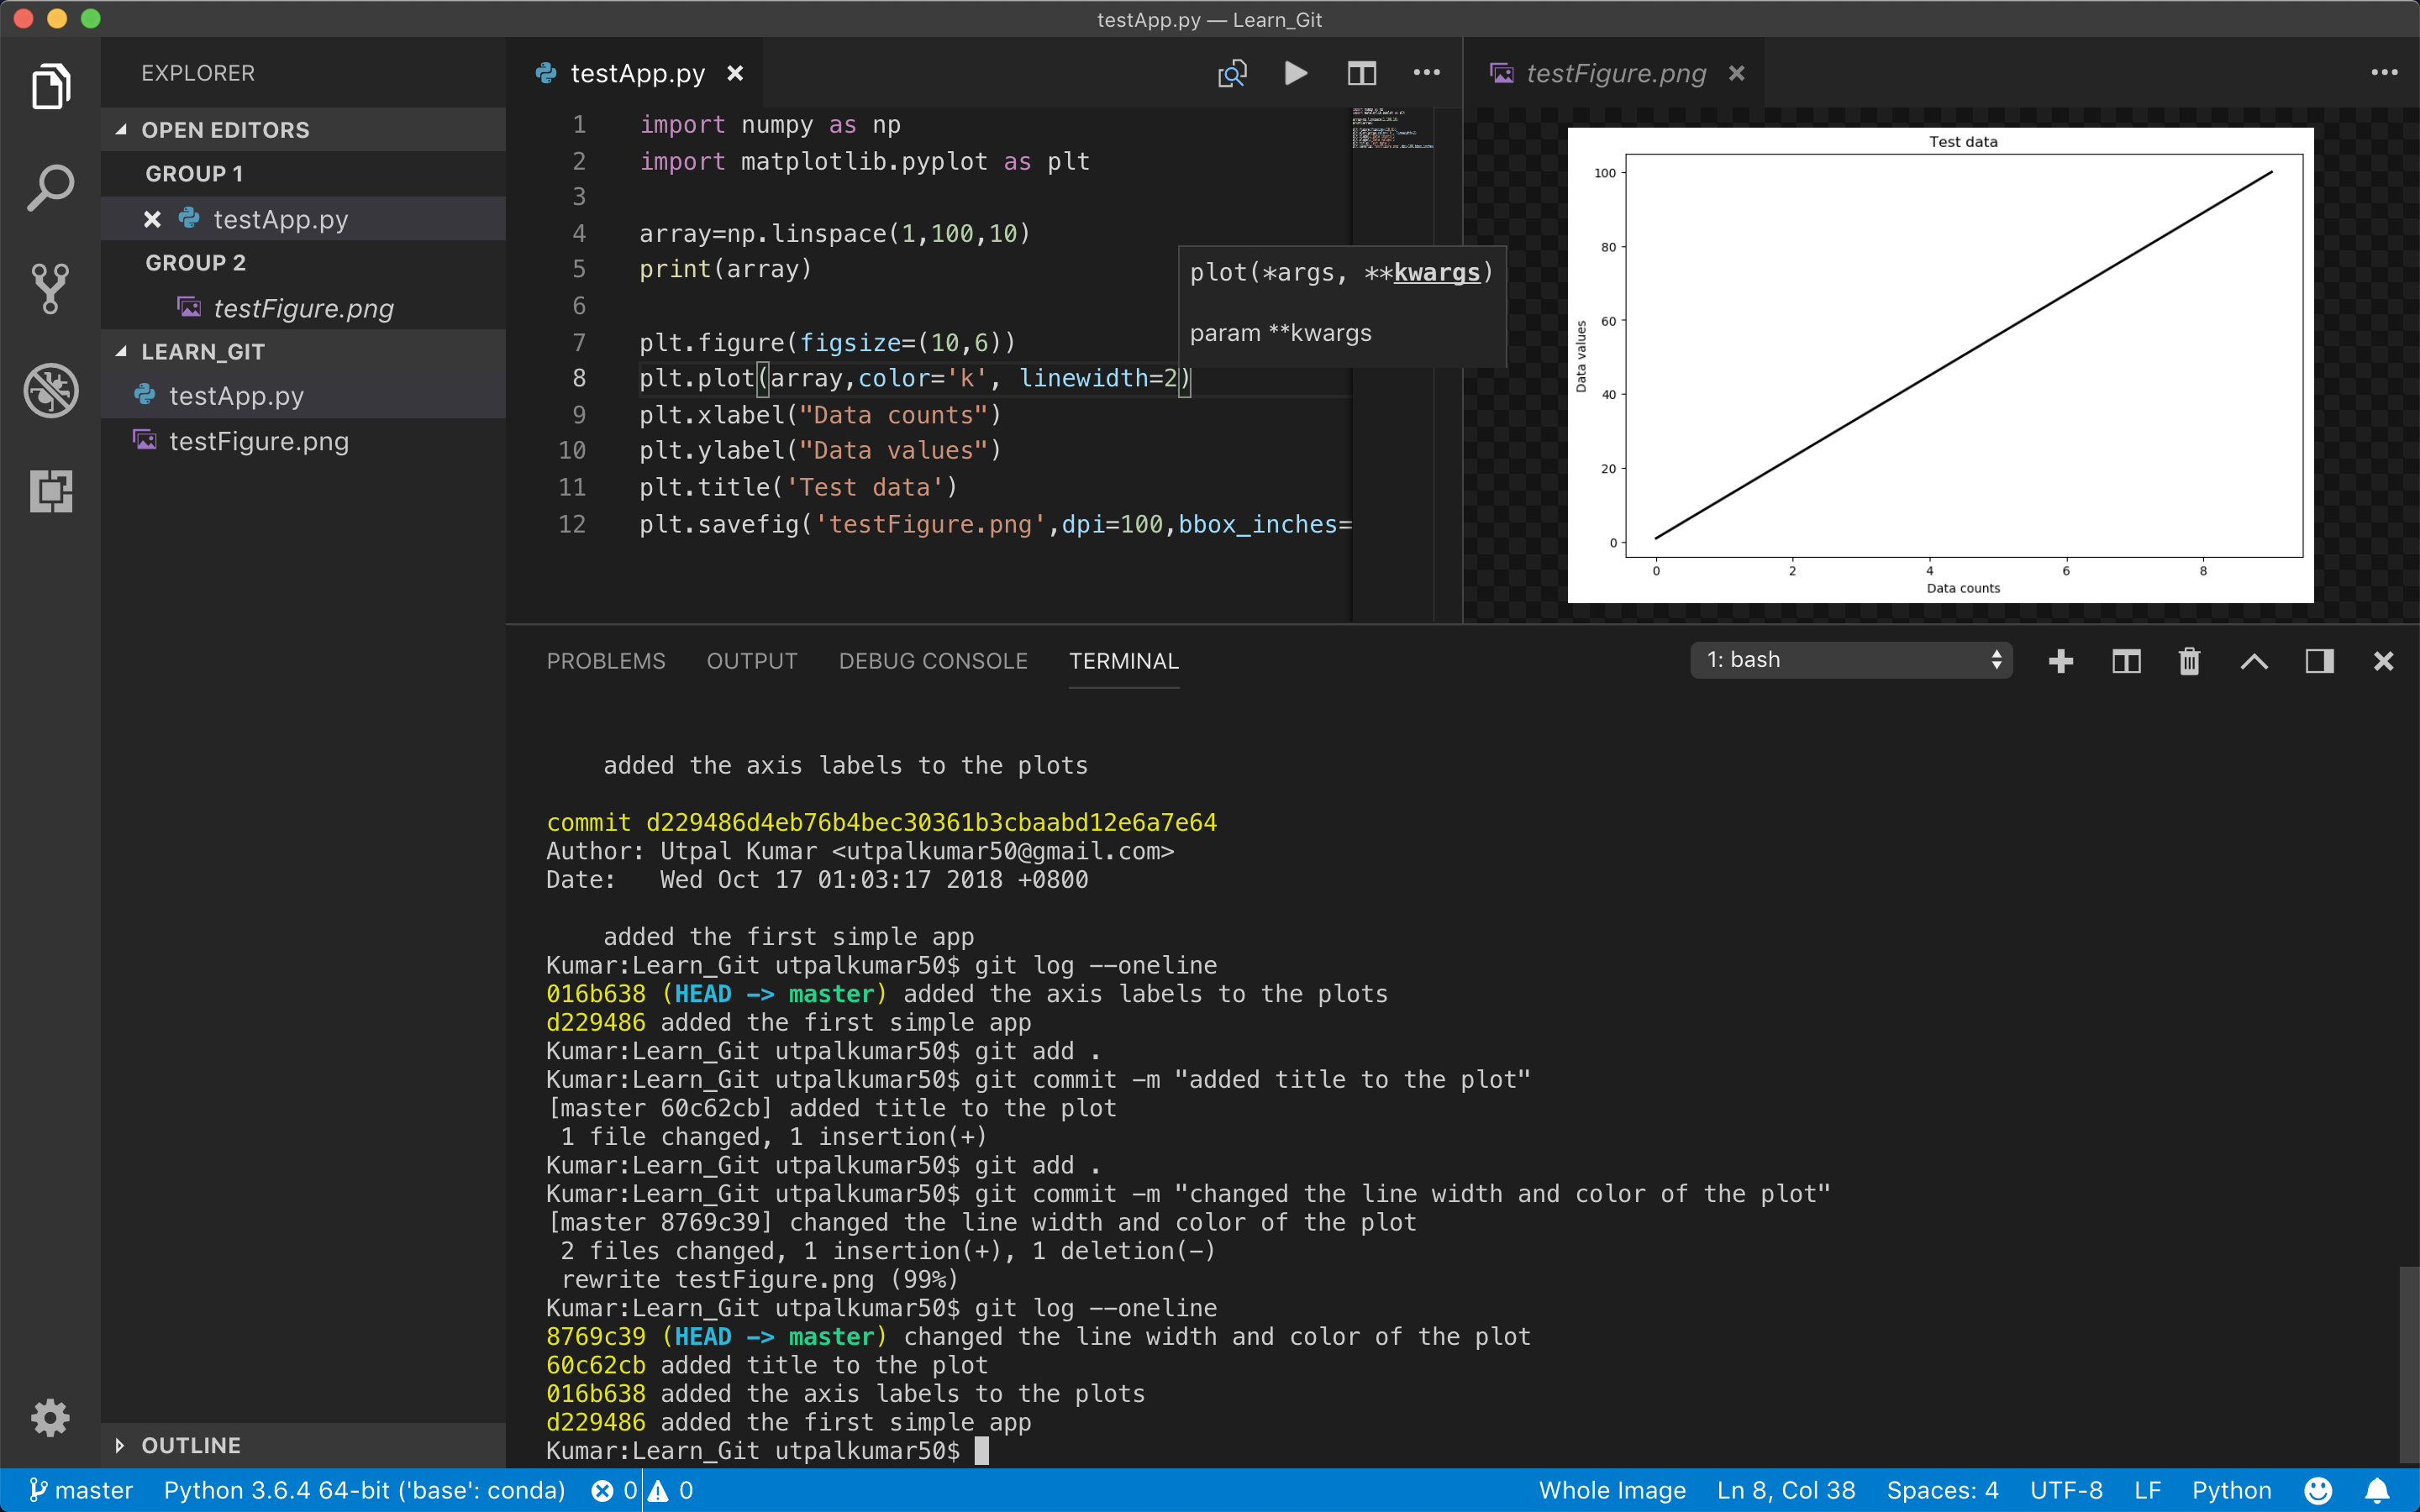 Here, I have added 2 more commits and output the total of 4 commits.
Now, if we wanna see the state of the code at the point we added the axis labels only, we can do that.
git checkout 016b638
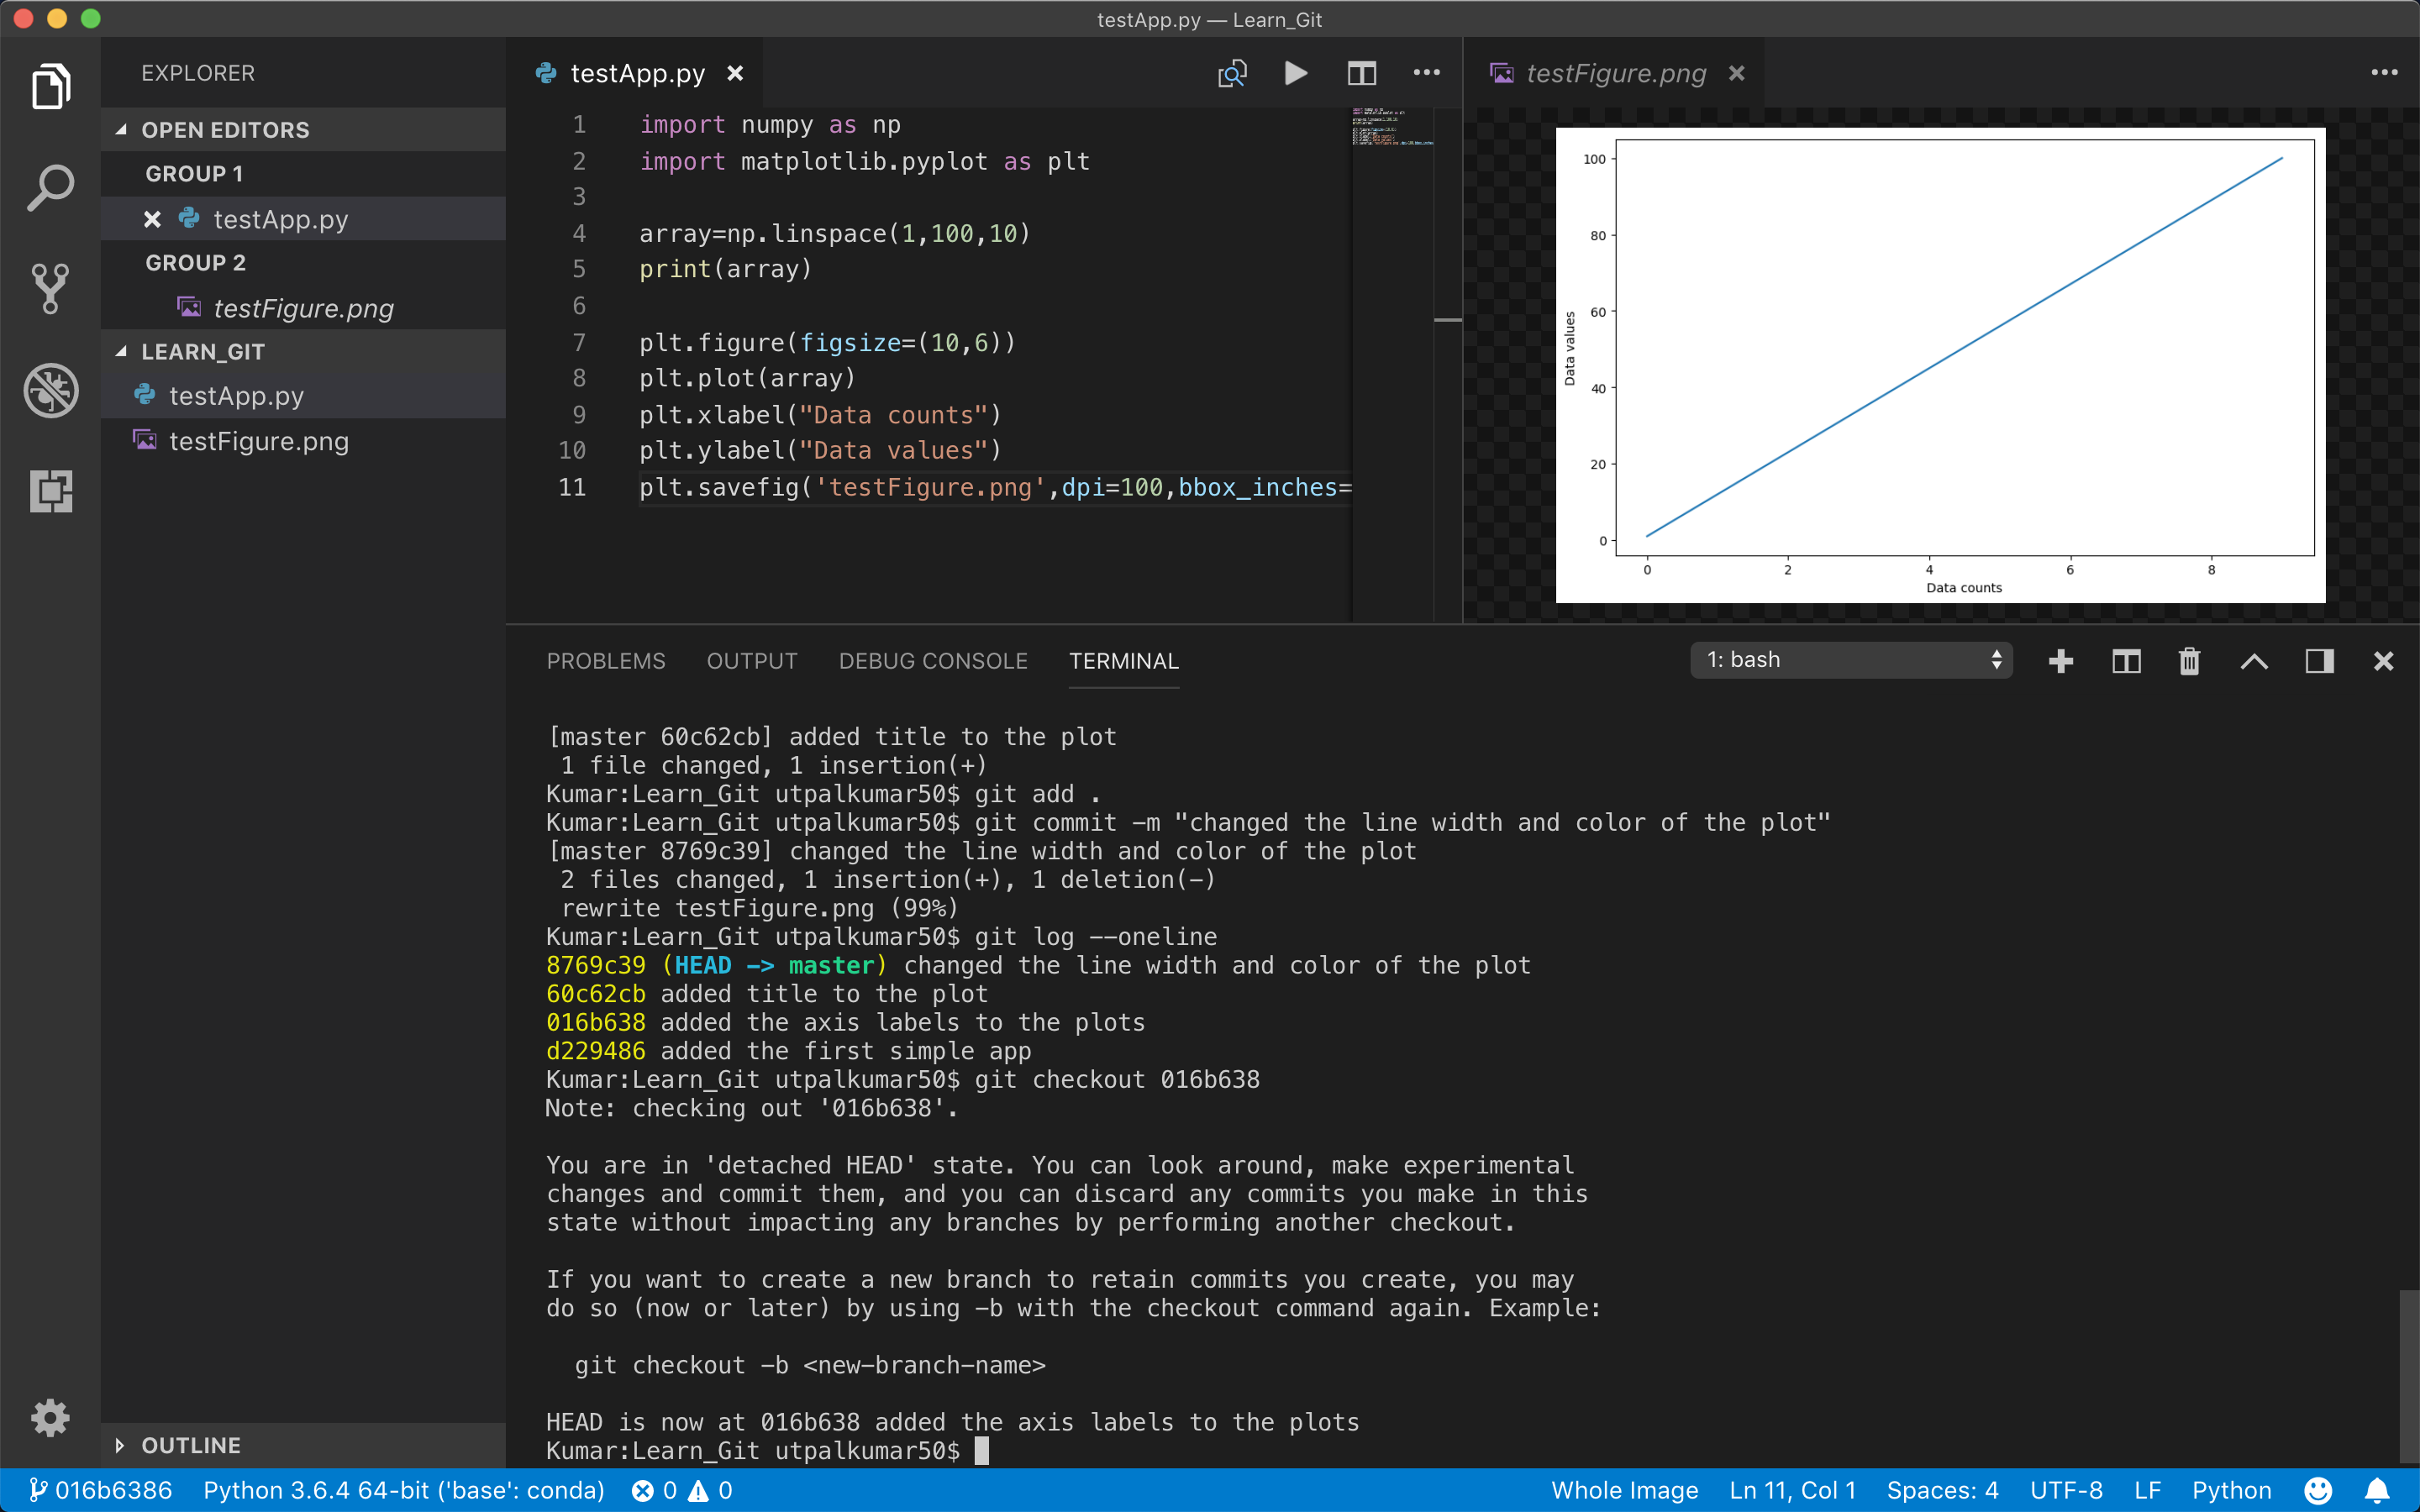
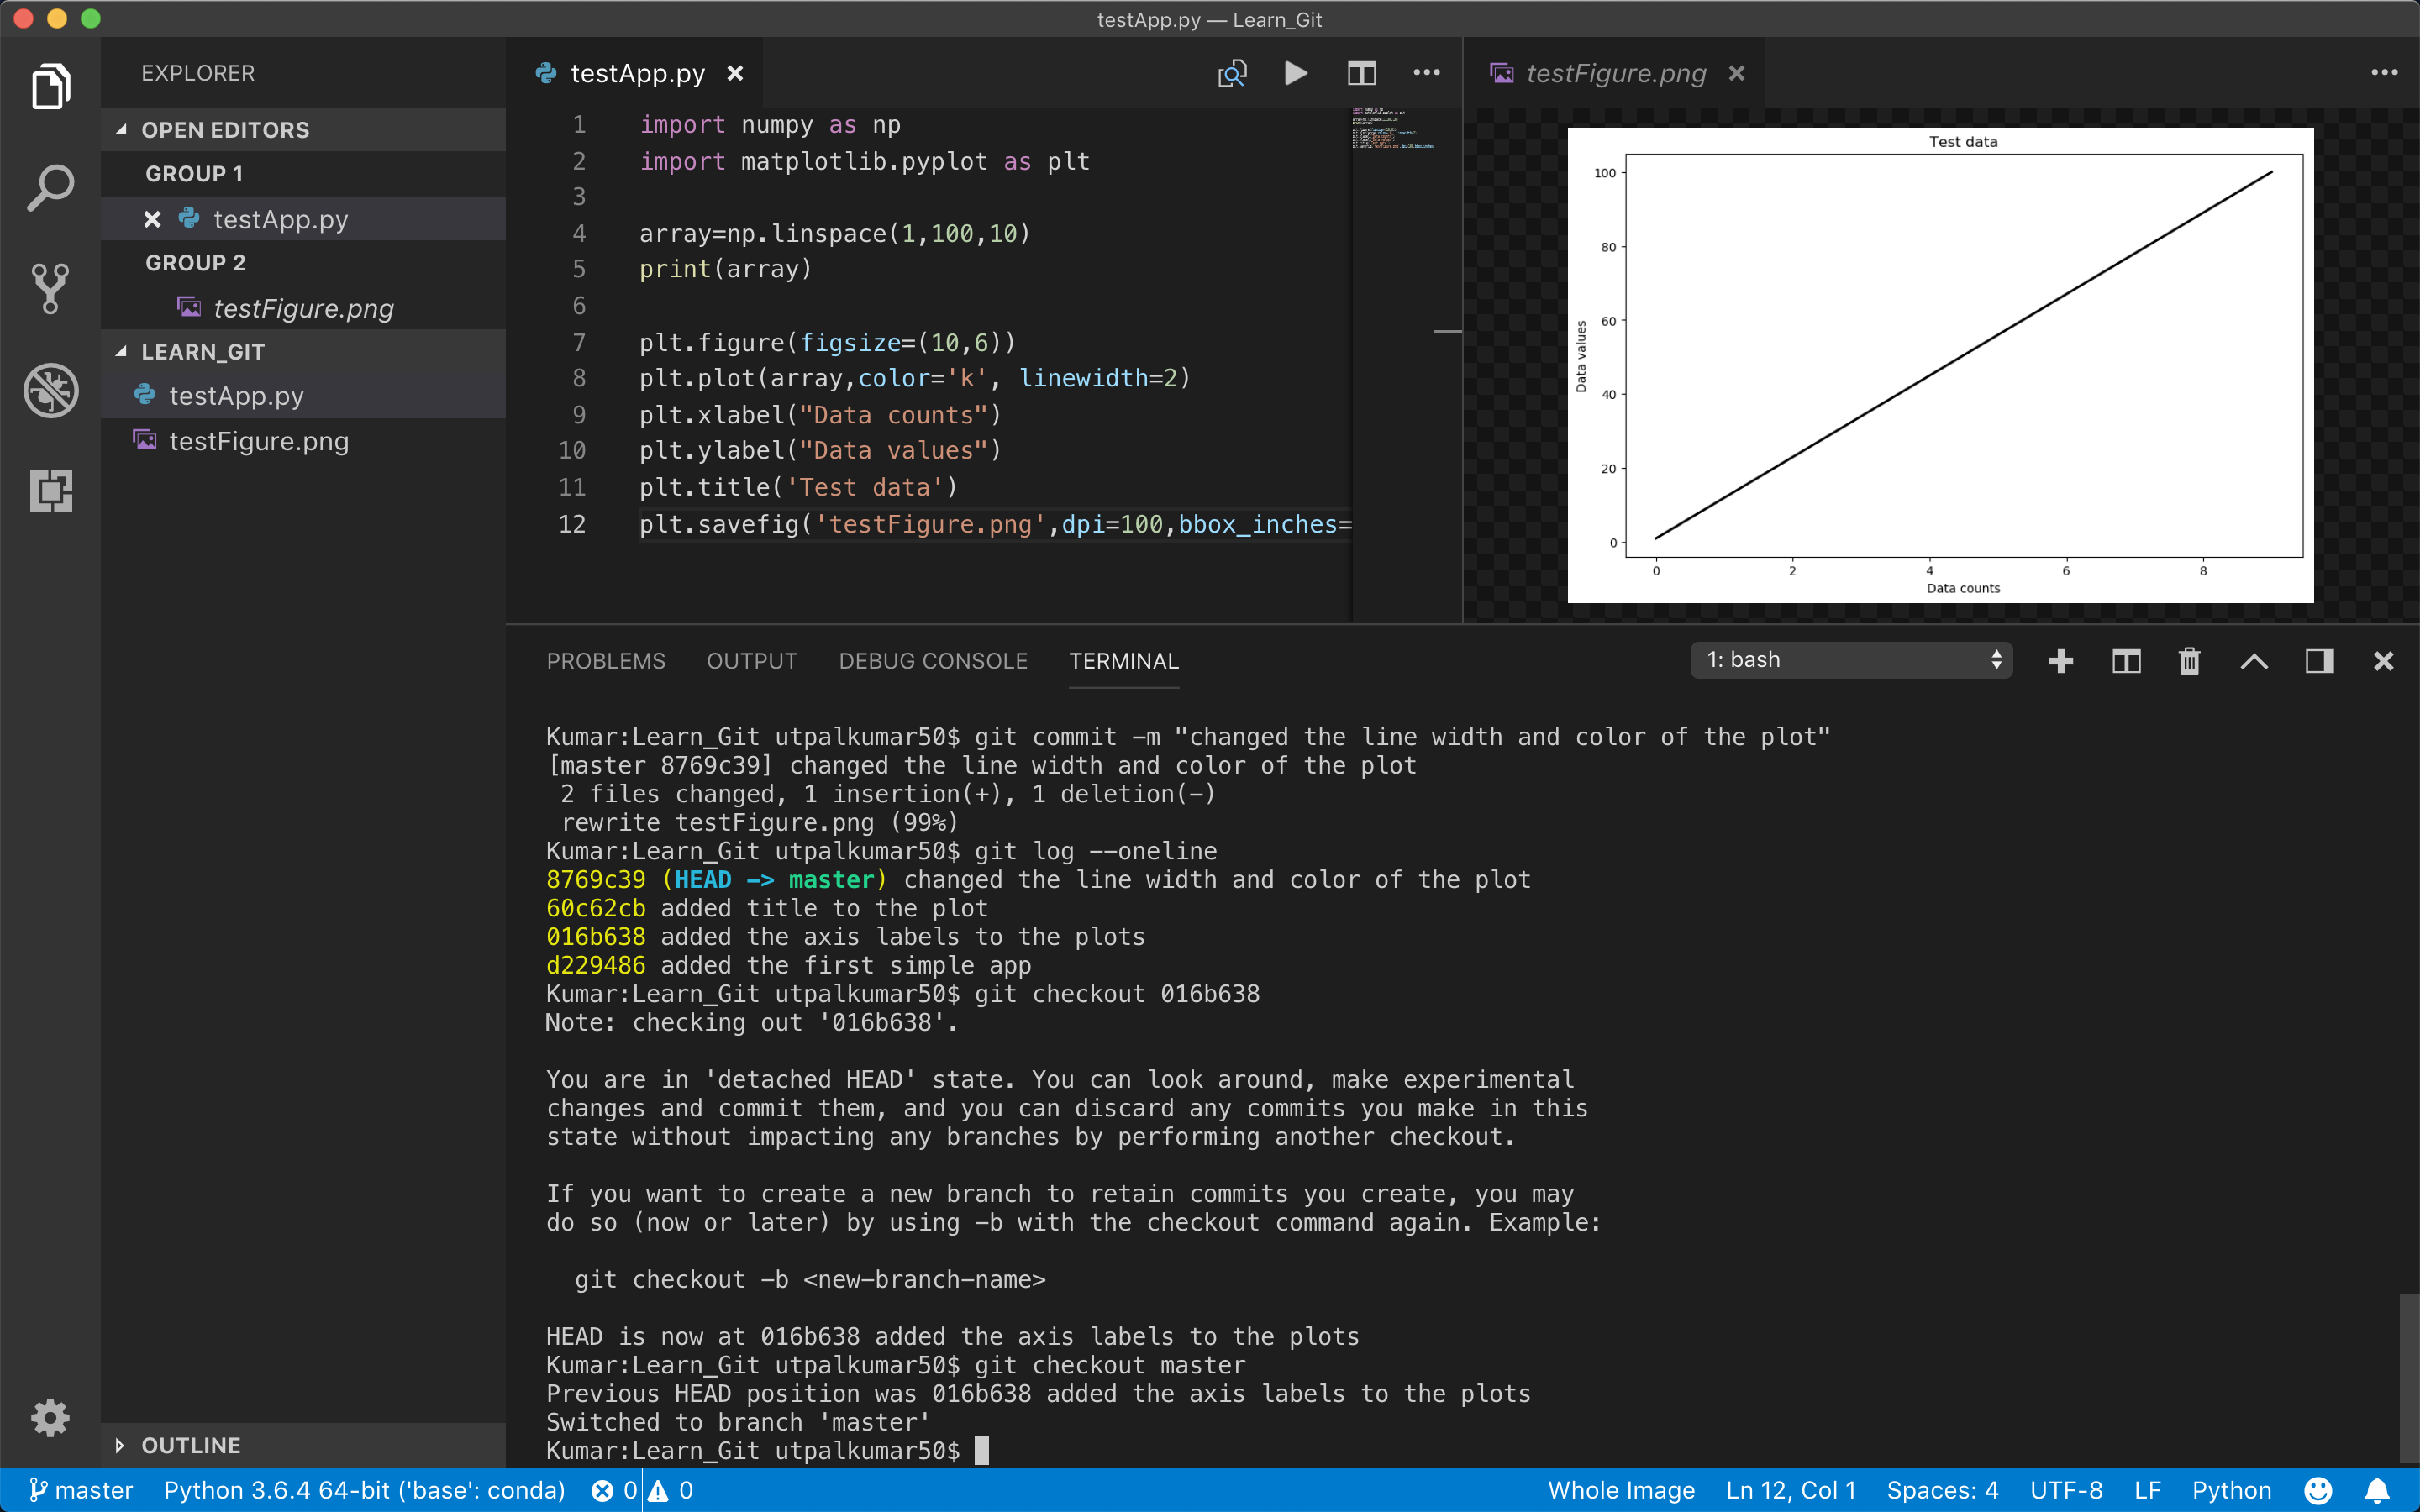
This takes us back immediately to the previous version where we didn’t have the title or have changed the line styles. This is the best way to go back in time, inspect the past without changing anything. Now, we can come back to the present time by just using the command:
git checkout master
Now, let’s say we wanna remove the commit where we have added the title to the plot. We can do that using the command:
git revert 60c62cb
When we execute this command, we get the following on the screen. Don’t get intimidated. This is a vim text editor which is asking you to give the title to this commit.
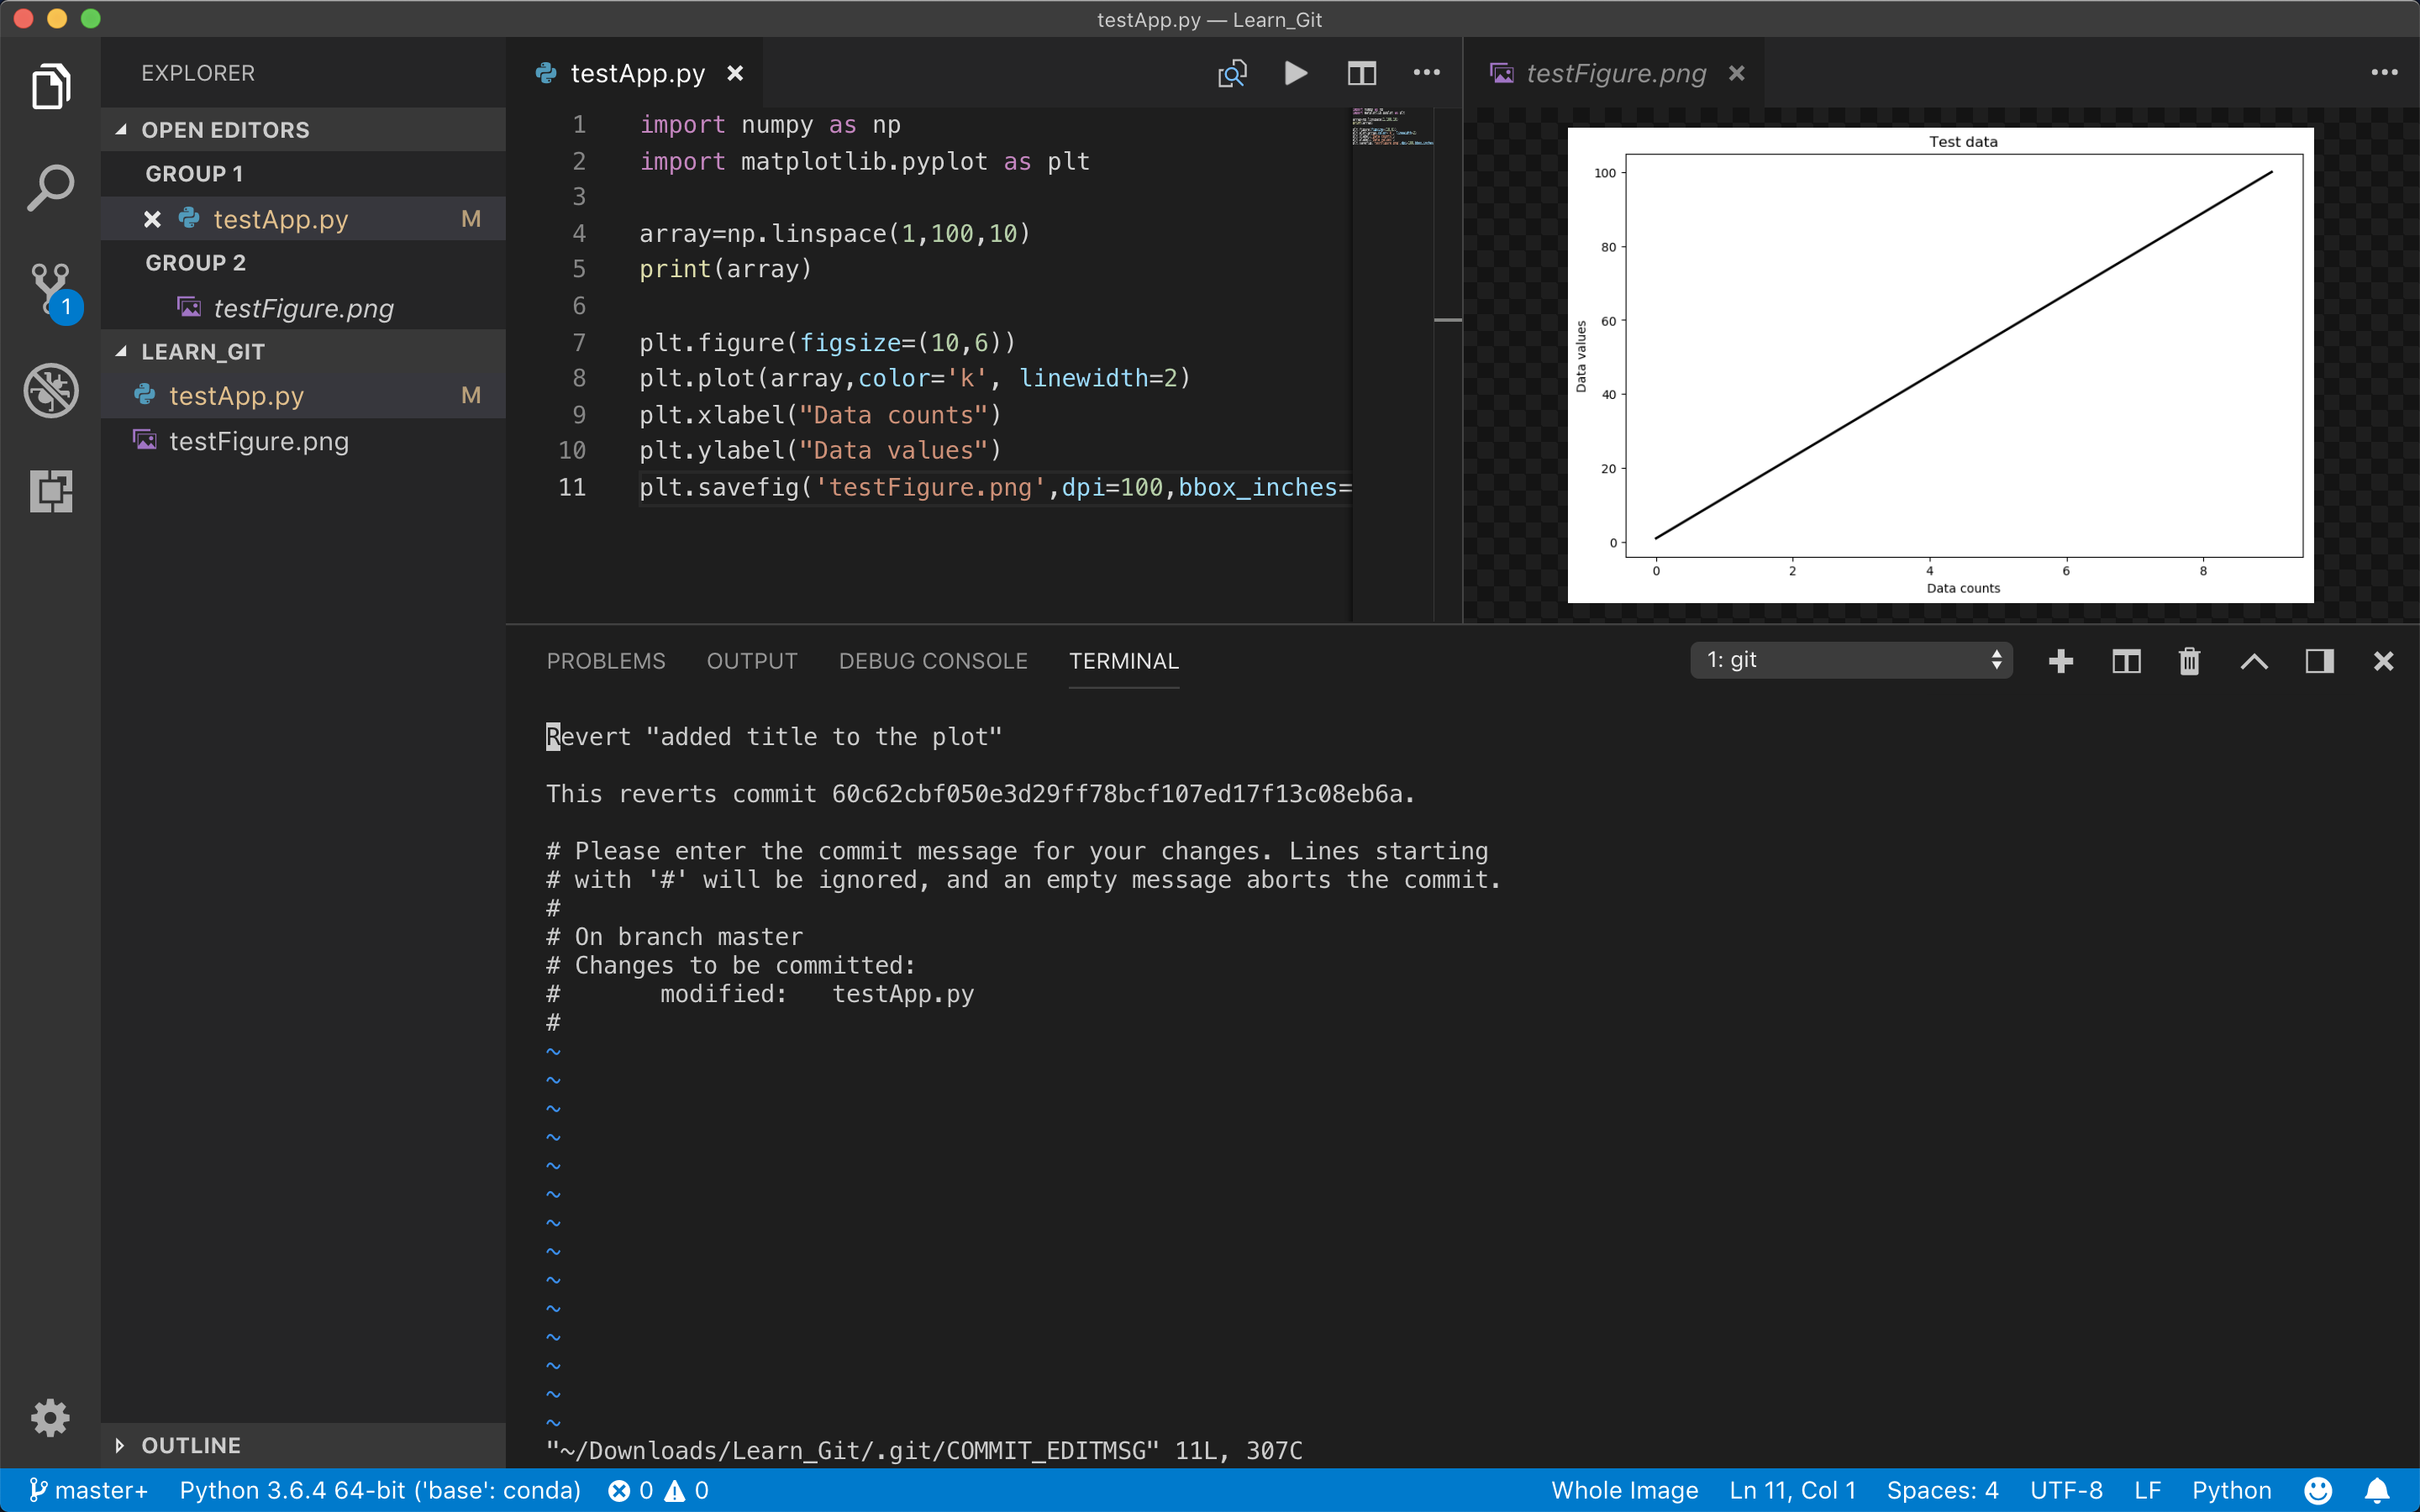
We type “:wq” to save that file and quit.
Now, we can see that this has removed the line in the code which added the title to the plot. But when we log the commits, we see that it has not actually deleted the commit but added a new commit which has reverted that commit.
Okay, if we want to permanently delete some commits and go back to the point in history, we can use the “reset” option
git reset 016b638
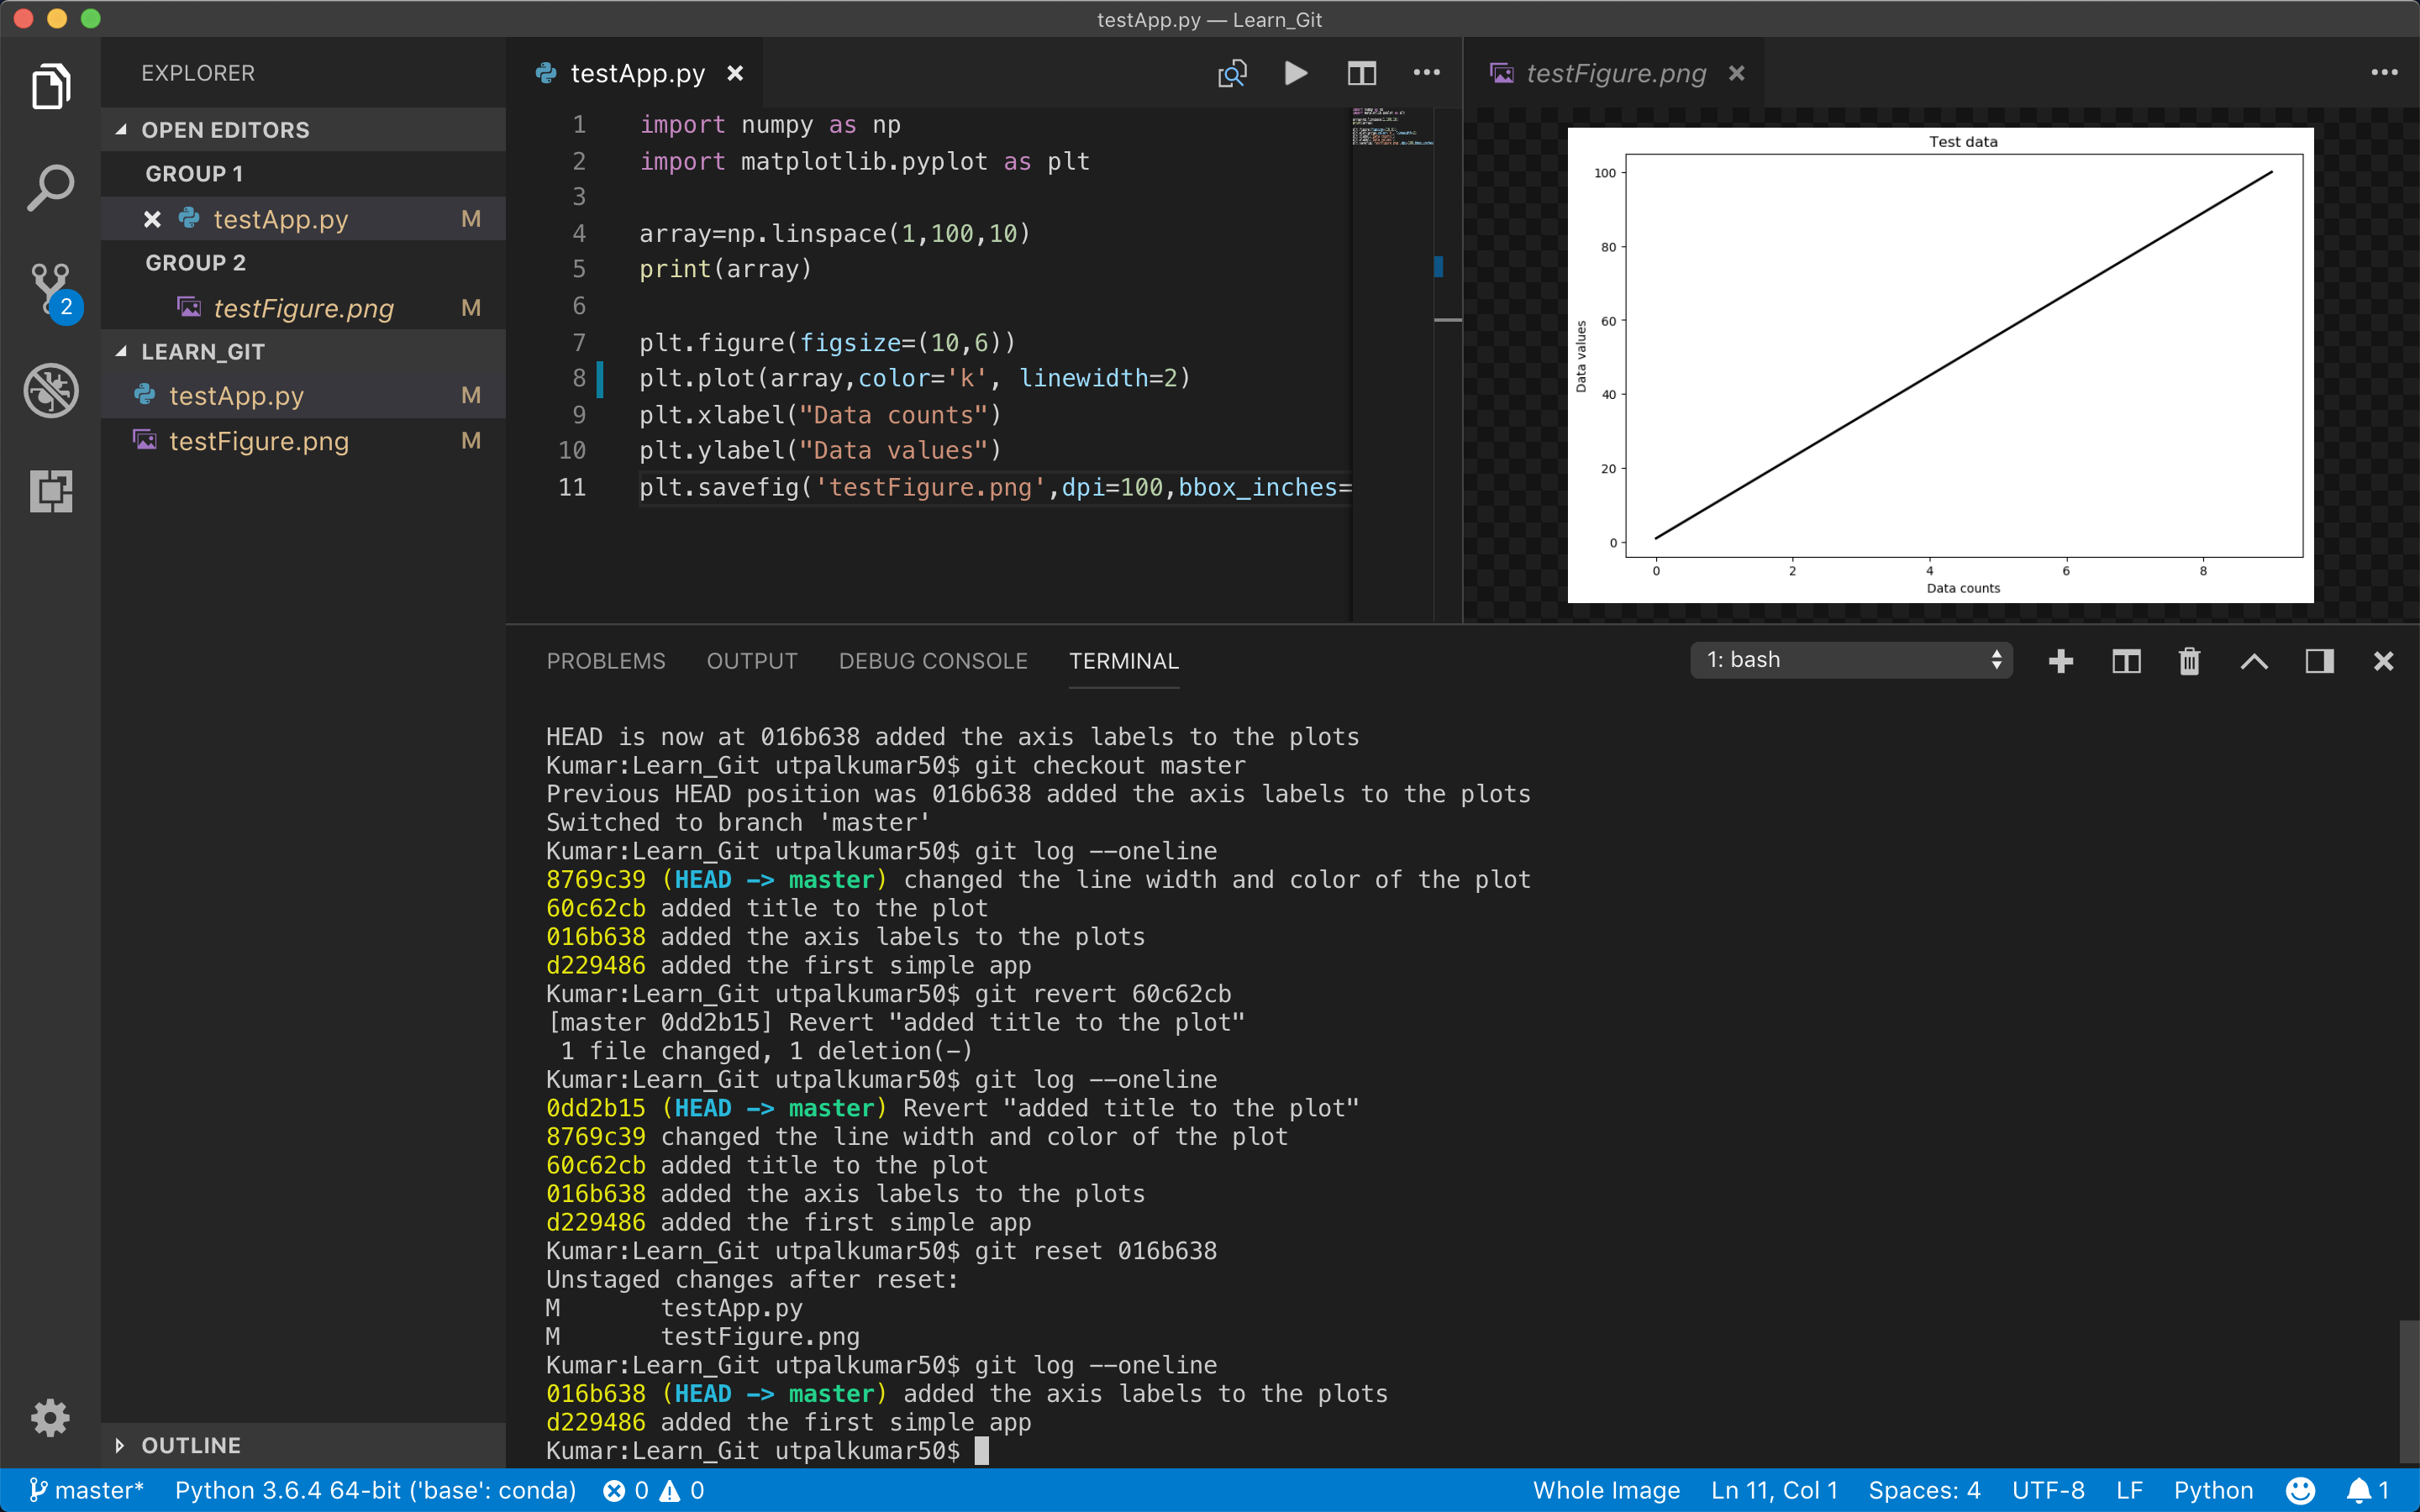
Now, we see that all the commits from the point we moved in the past has been deleted but the code stays unchanged. This is a good way to merge some commits into one. But if we are really strict and want to change the code as well, we can do that using the flag “hard”:
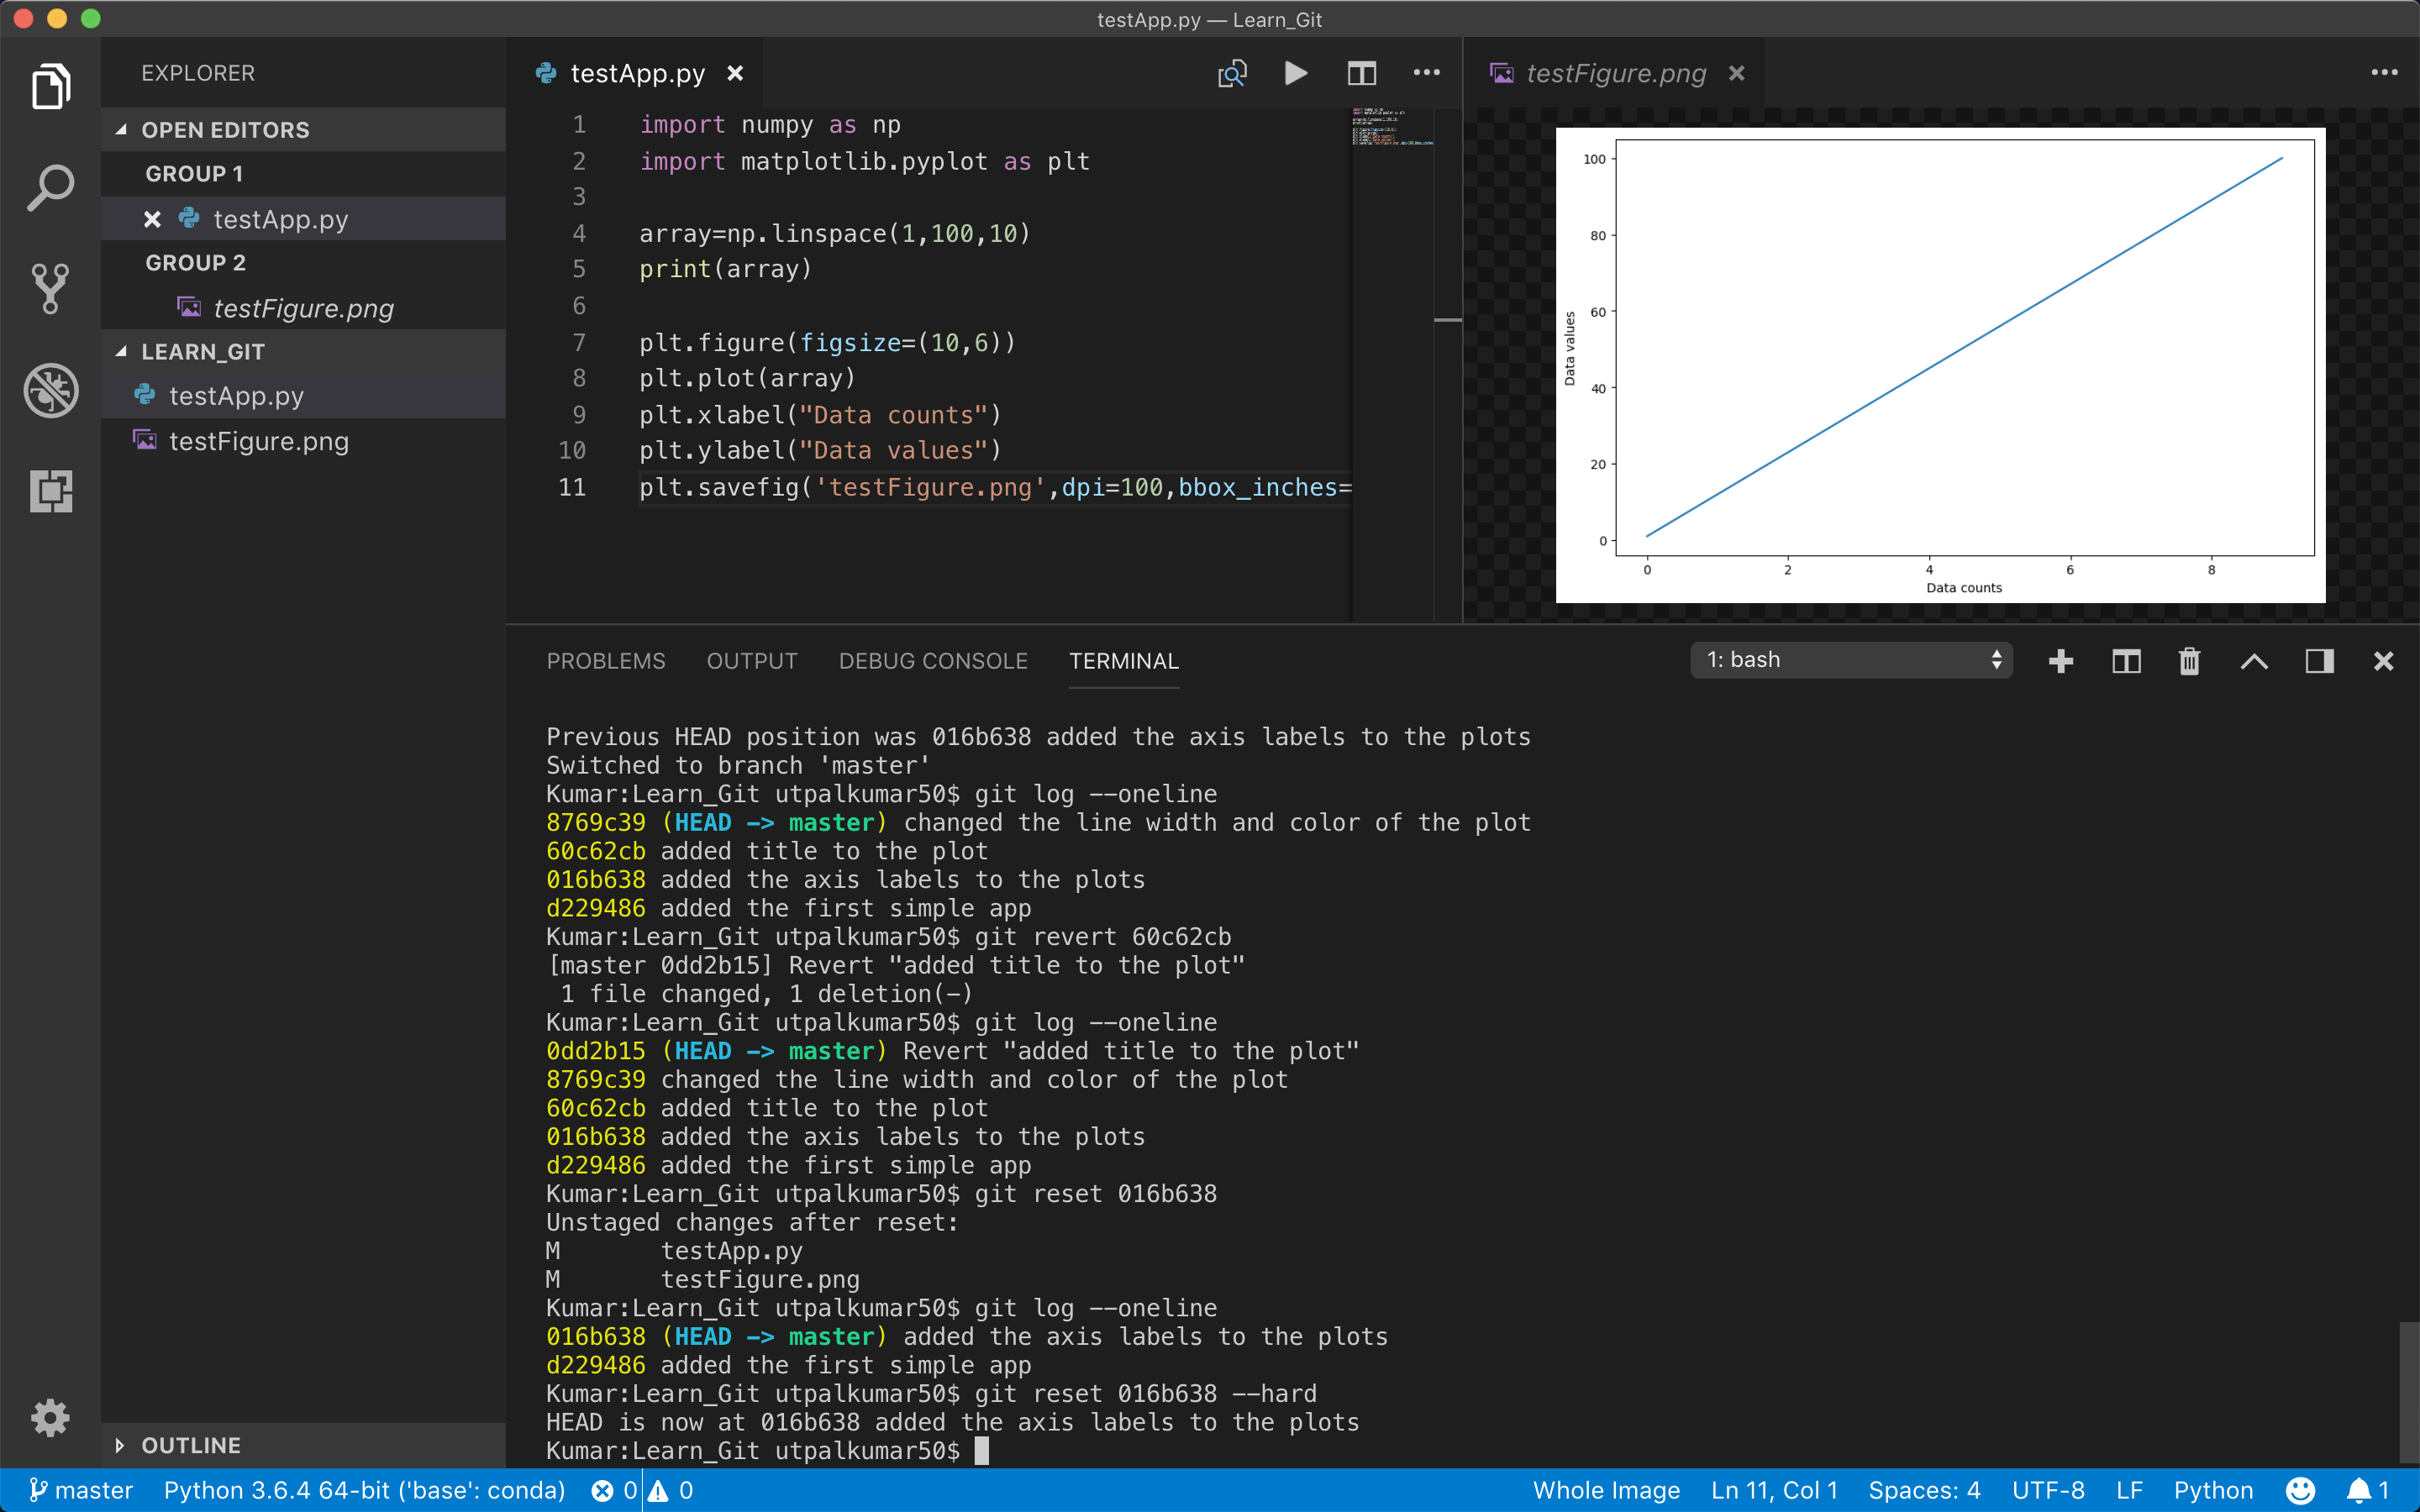
Beware that now there is no way to get back to the versions where we had title and linestyles.
Branches
So far we have been working on one branch that is the “master” branch of the repository. When we make any commits, we were committing only to the master branch. We usually use the master branch to represent the stable version of our codes. For that reason, we don’t really wanna try new features or new codes on this branch as there is a risk of messing up the code. What we can do is try out the new feature in an isolated environment and if we like it then we can merge then in the master branch. This is mainly useful if more than one person is working on a project. They can make the branch of the code, apply several new features and when they are really satisfied then they can add it to the master branch.
If we wanna add the branch at this point of the code, we can do
git branch feature1
If we wanna see all the branches, we type
git branch -a
The asterisk (*) in front of “master” shows that we are currently on the master branch. To switch the branch, we use
git checkout feature1

Now, we can work on the branch “feature1” separately than the master branch
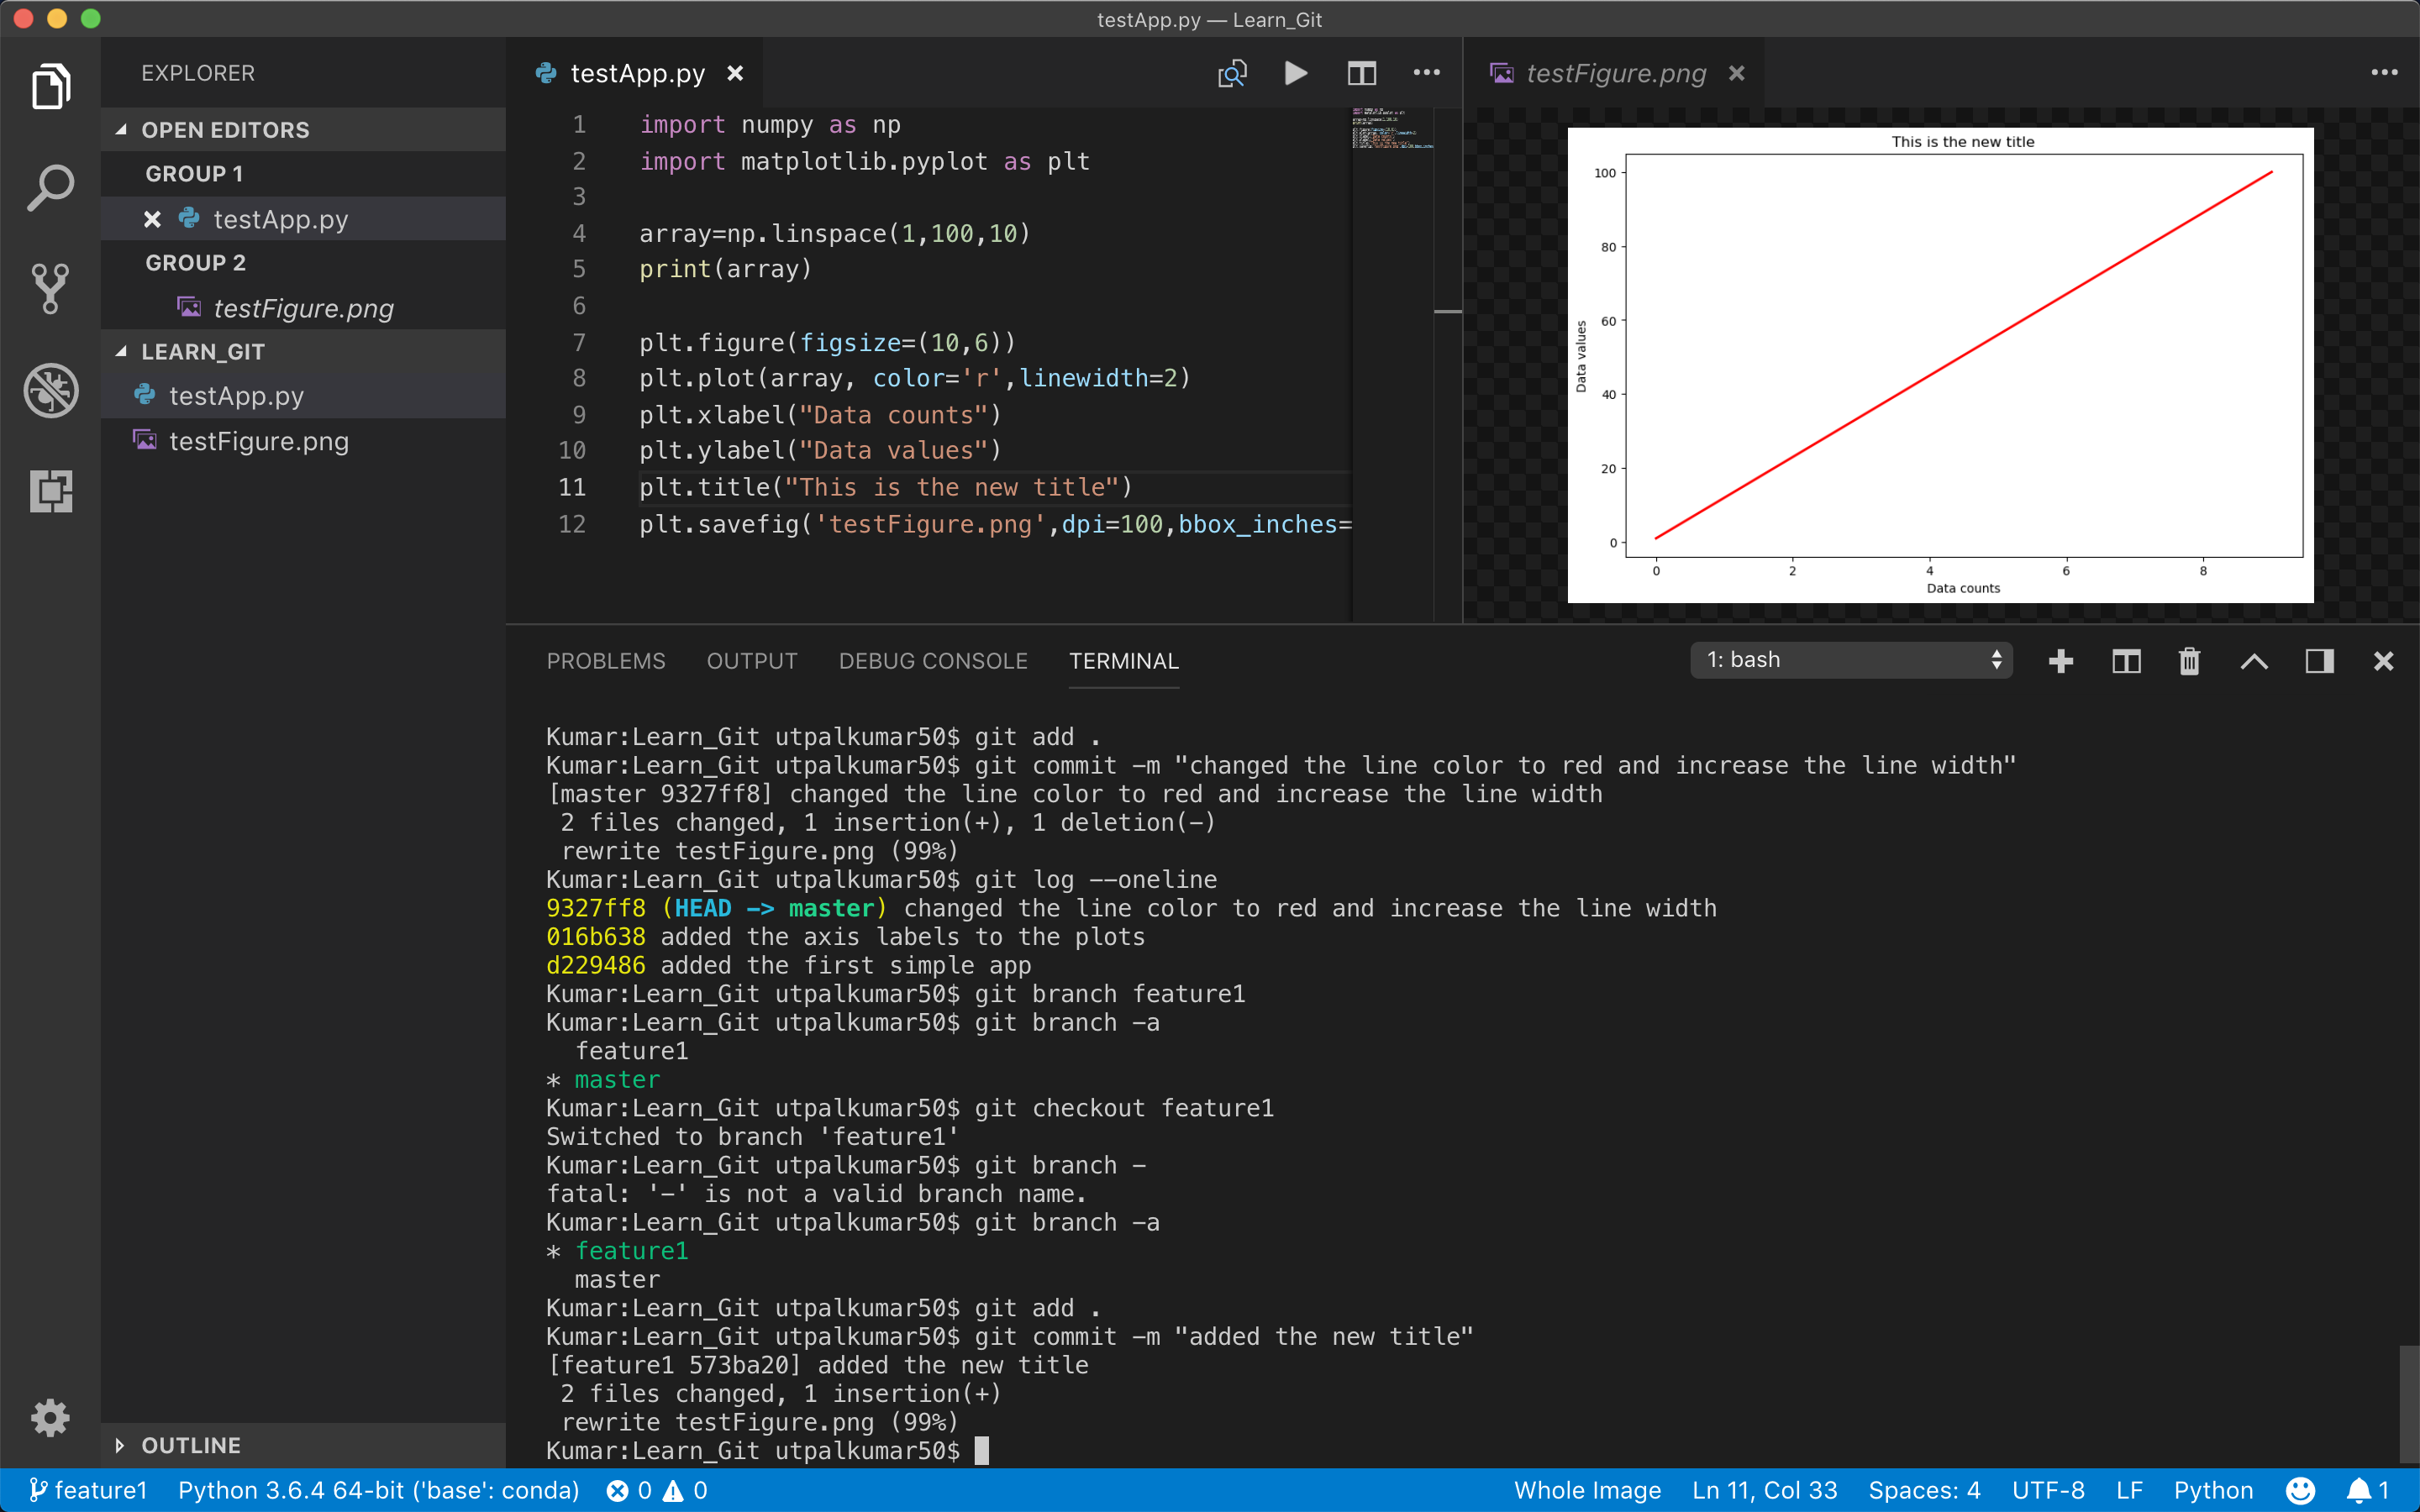
When we switch back to the master branch, we can notice that we have not actually added any title

If the things don’t work out as expected, we can even delete the branch
git checkout master# first we move to the master branch
git branch -d feature1 # this will give the error because this branch has not been merged with the master branch
Instead, we can use
git branch -D feature1
to forcibly delete the branch.
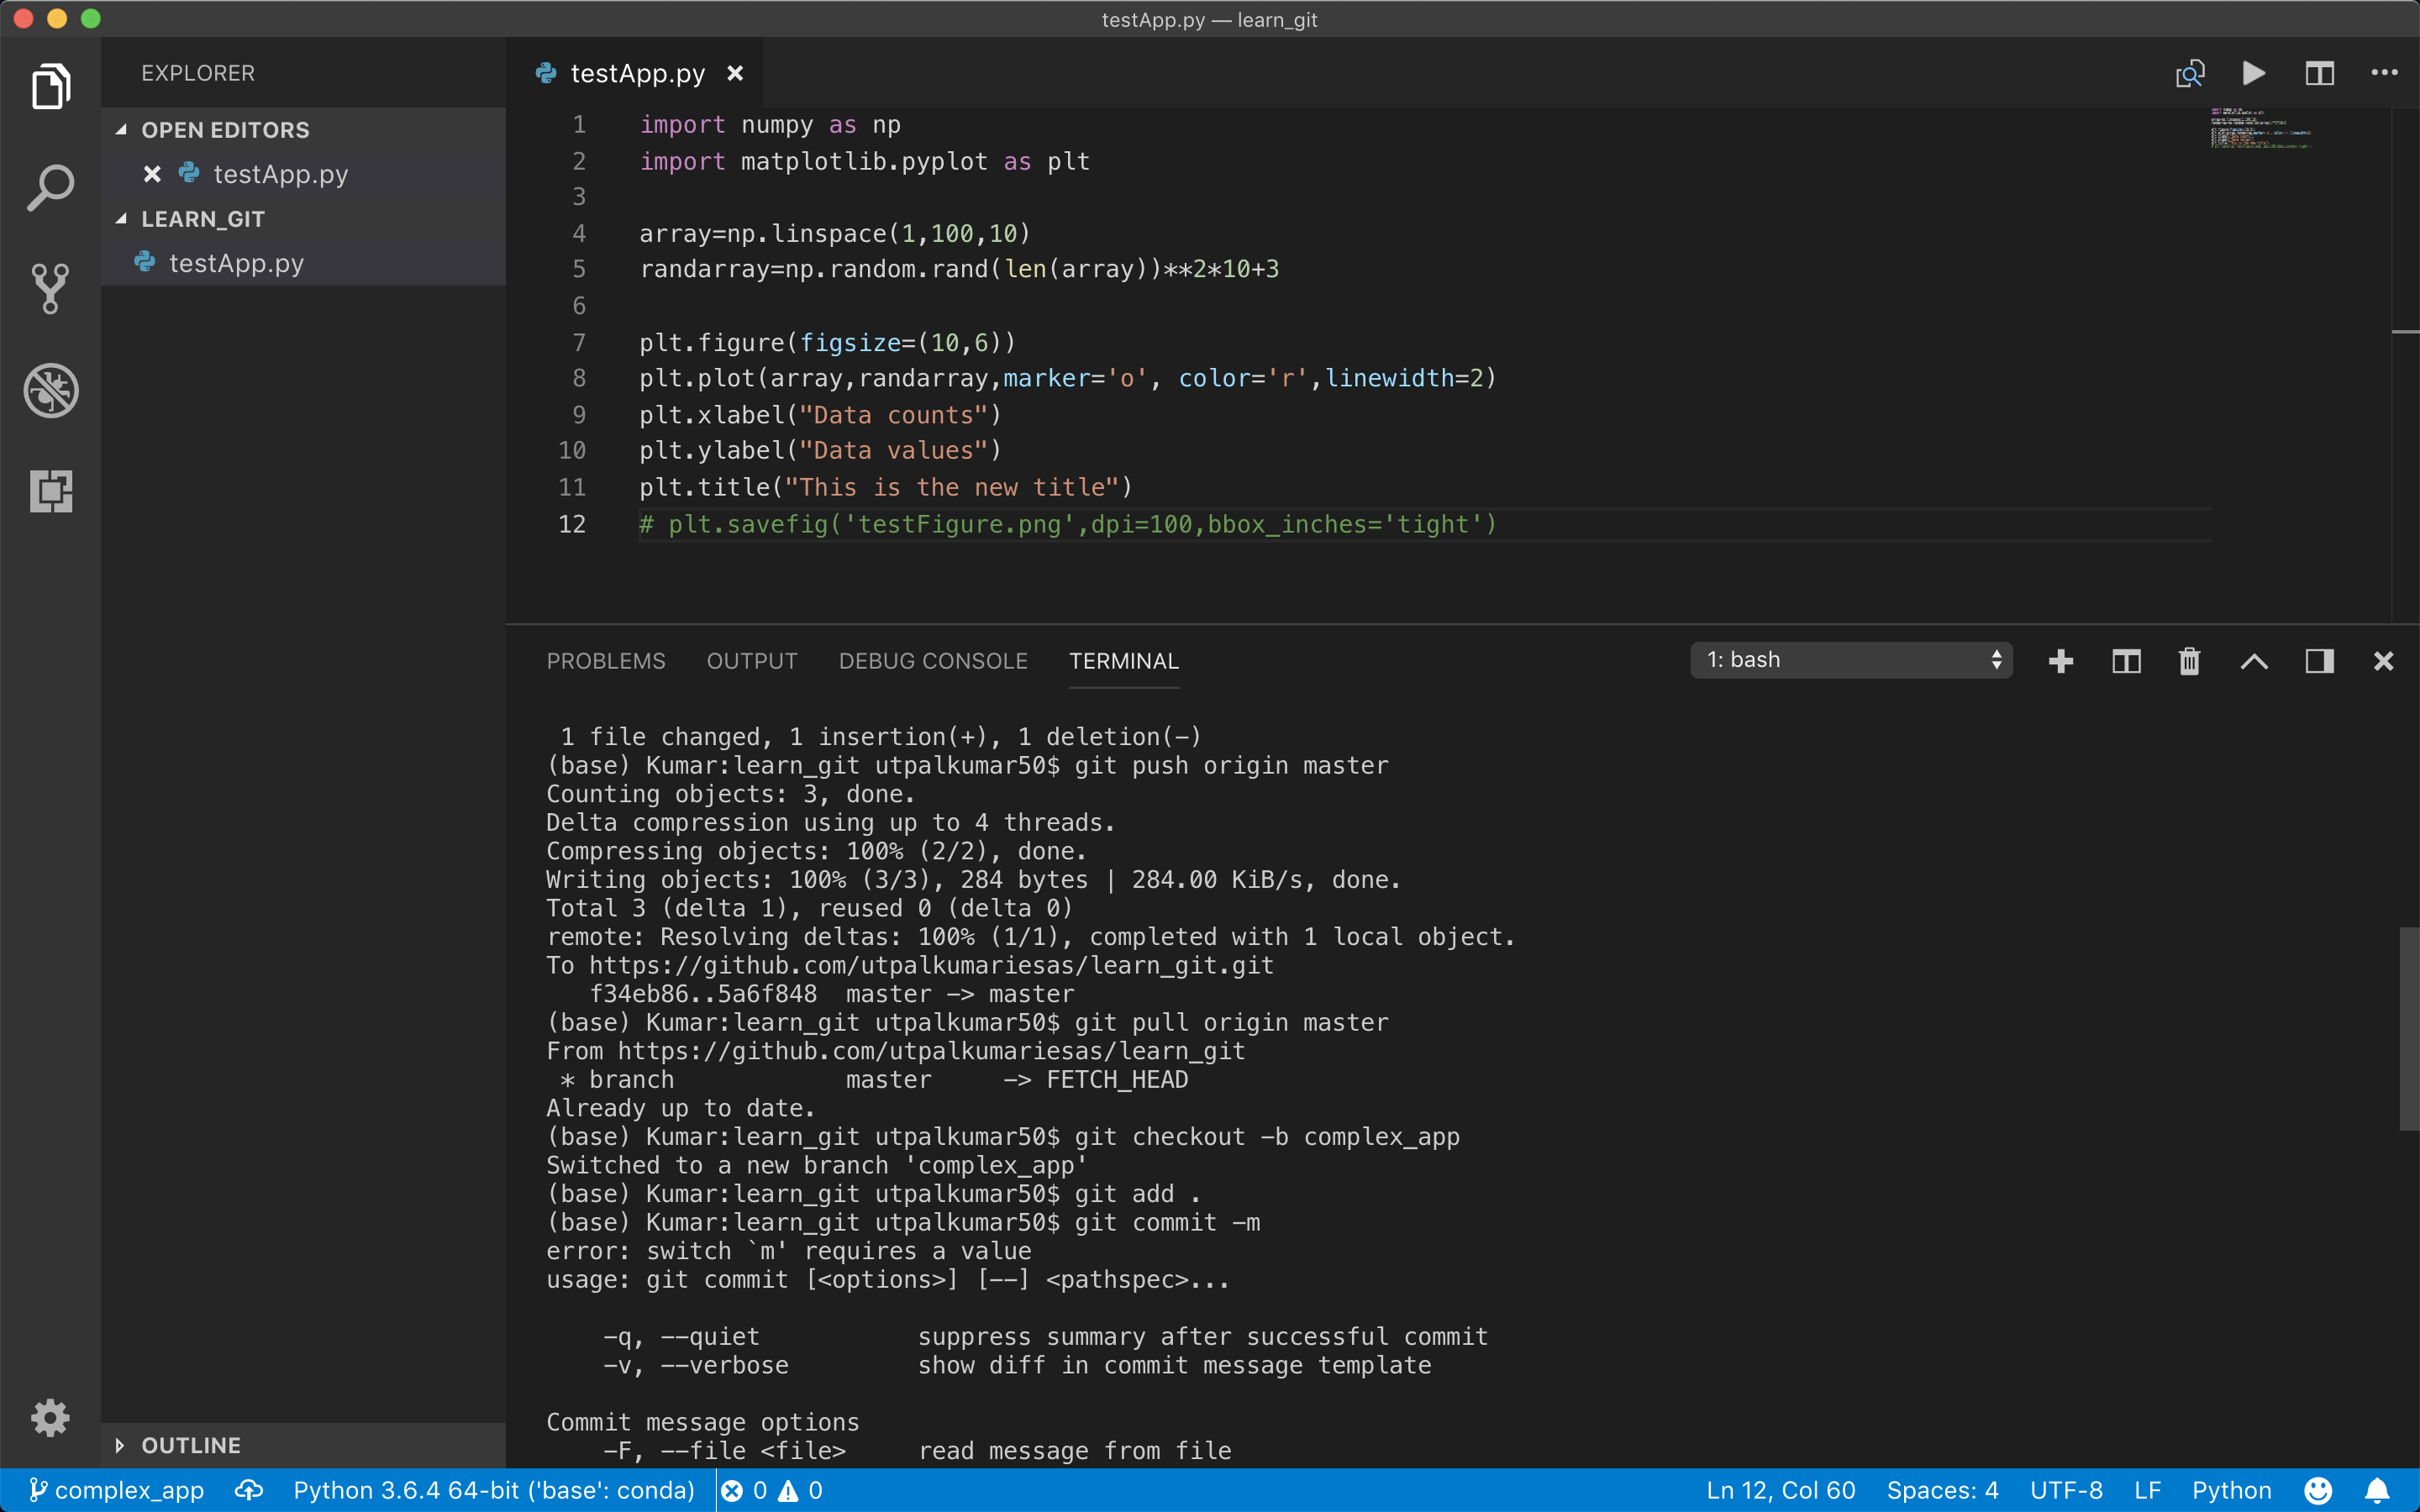
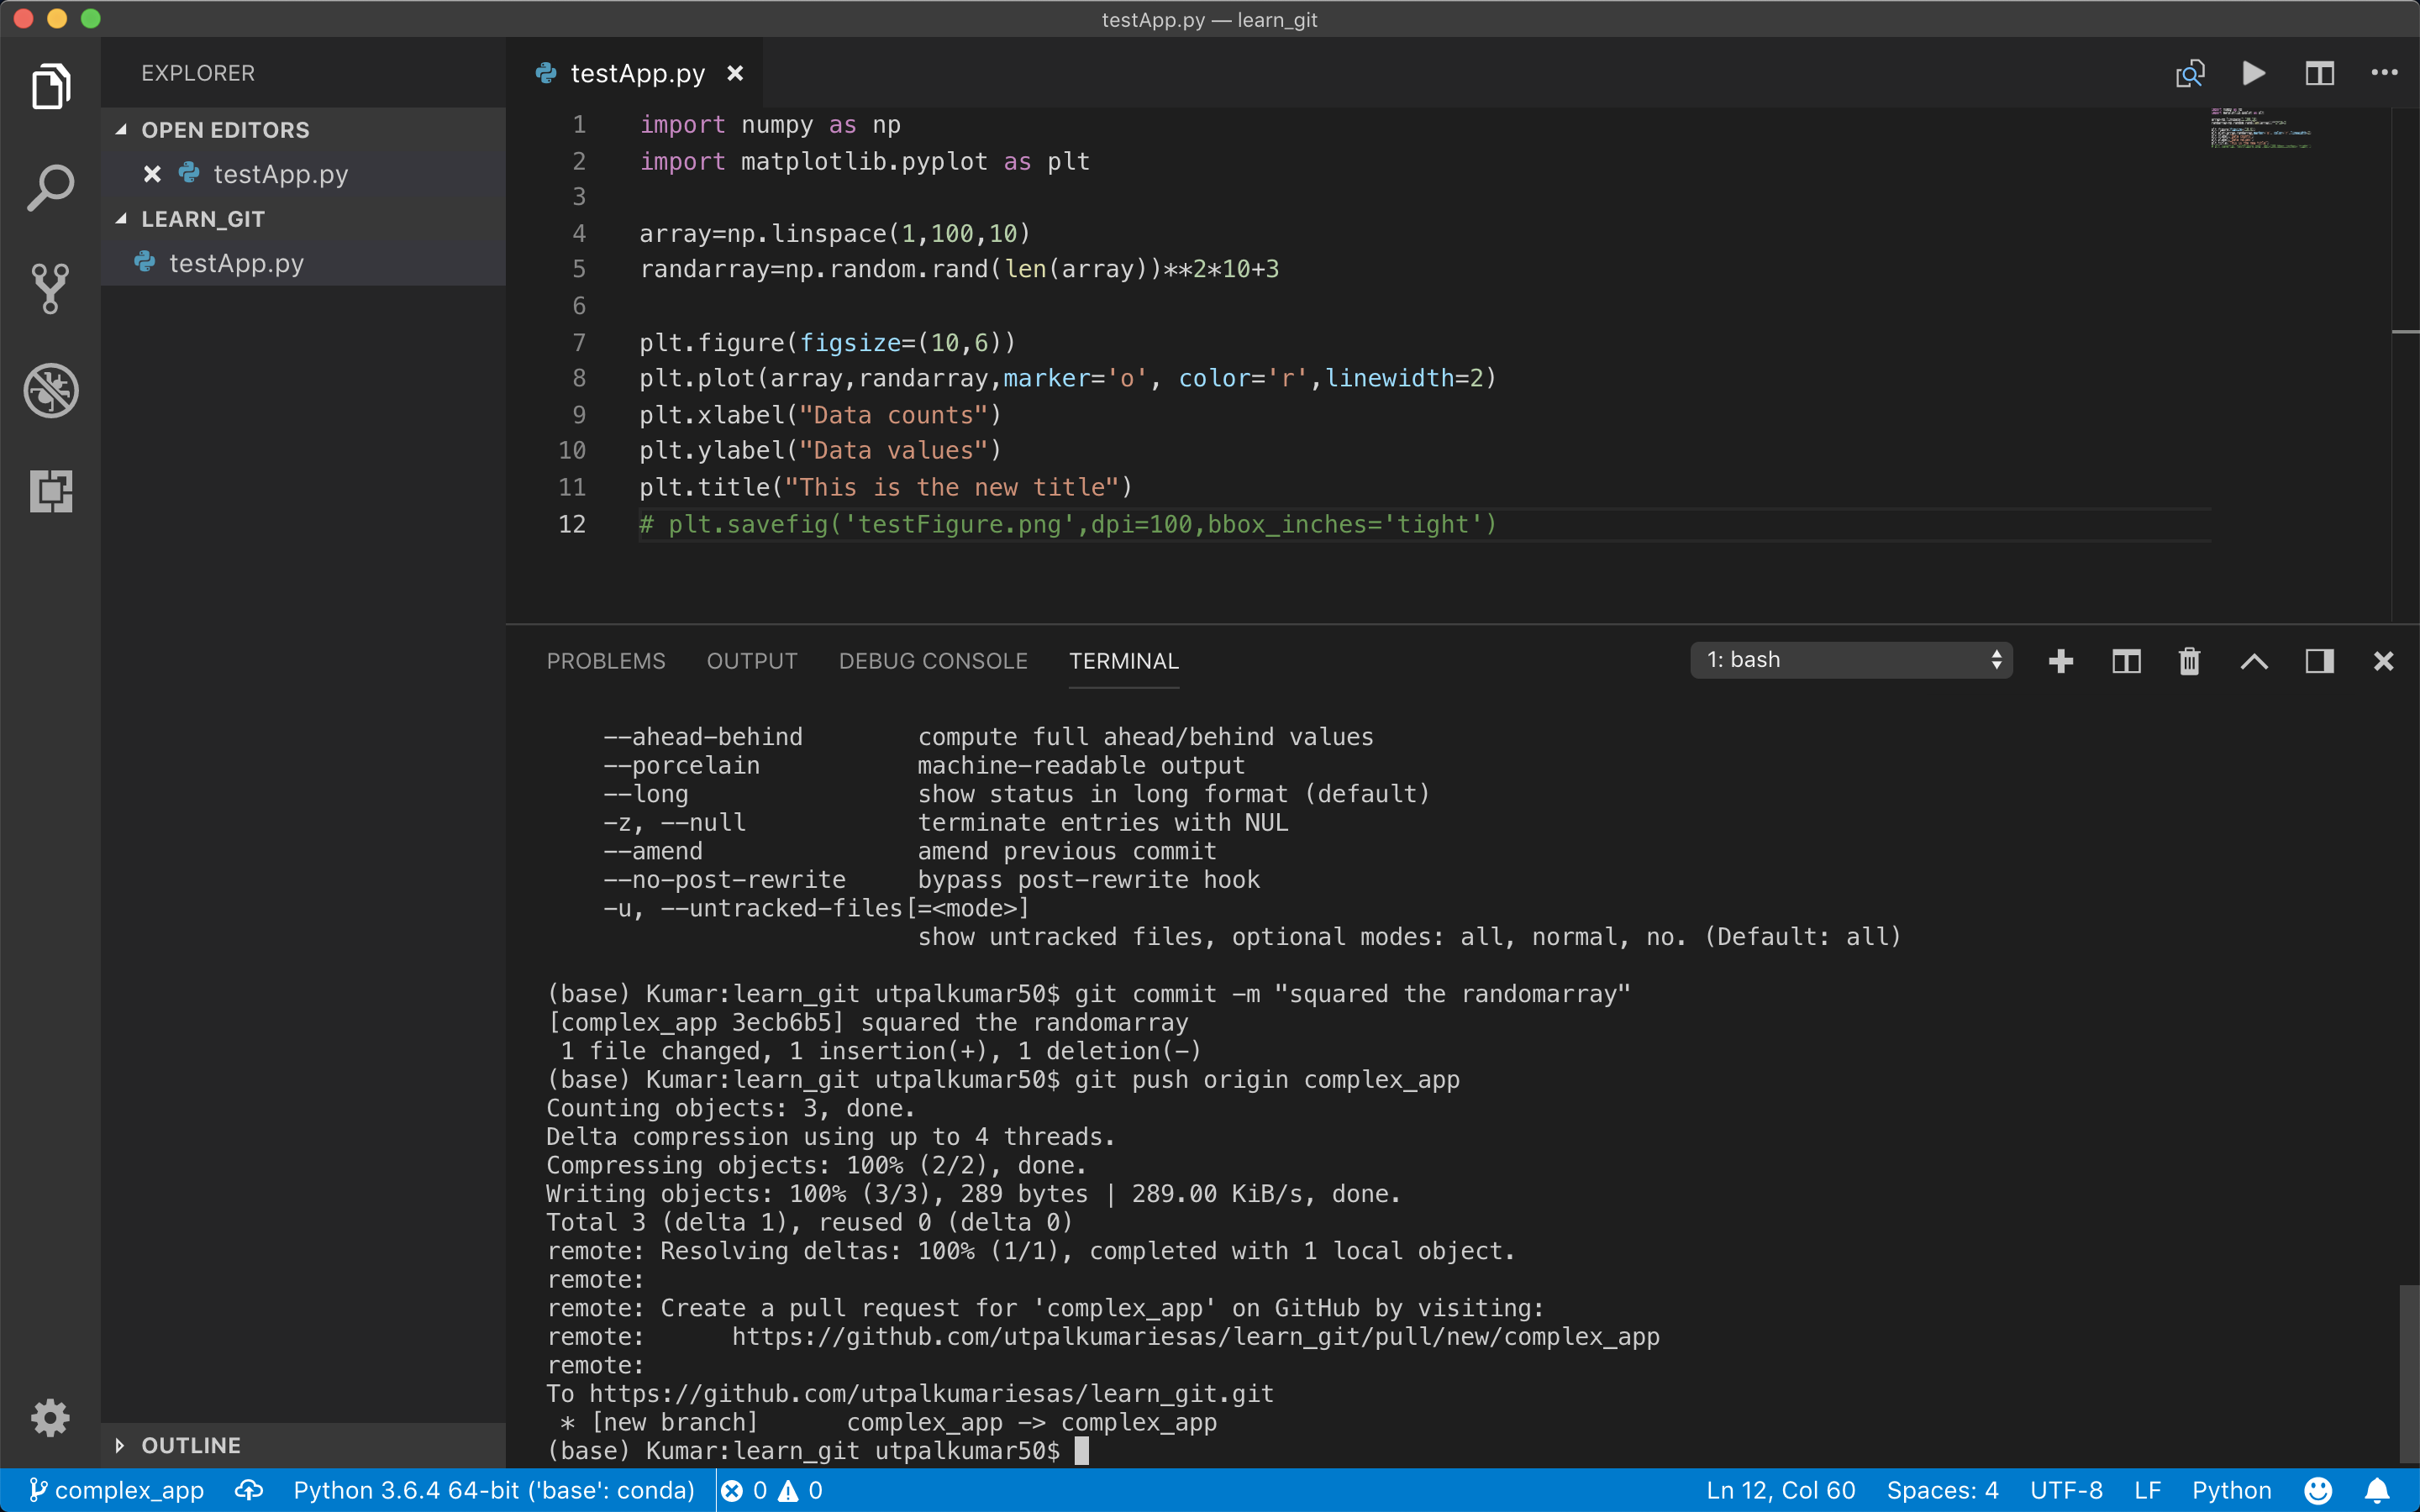
Okay, now let’s see more about working with the branches. The quick way of making a branch and checkout to it is
git checkout -b feature-a
Now, we work on this branch.

Now, we have two branches “feature1” and “feature-a” going on at the same time. But neither one is affecting the original codes. One branch has some changes to the plotting of the data and the other branch is having the title to the plot. Now, how do we merge those two changes to the master branch?
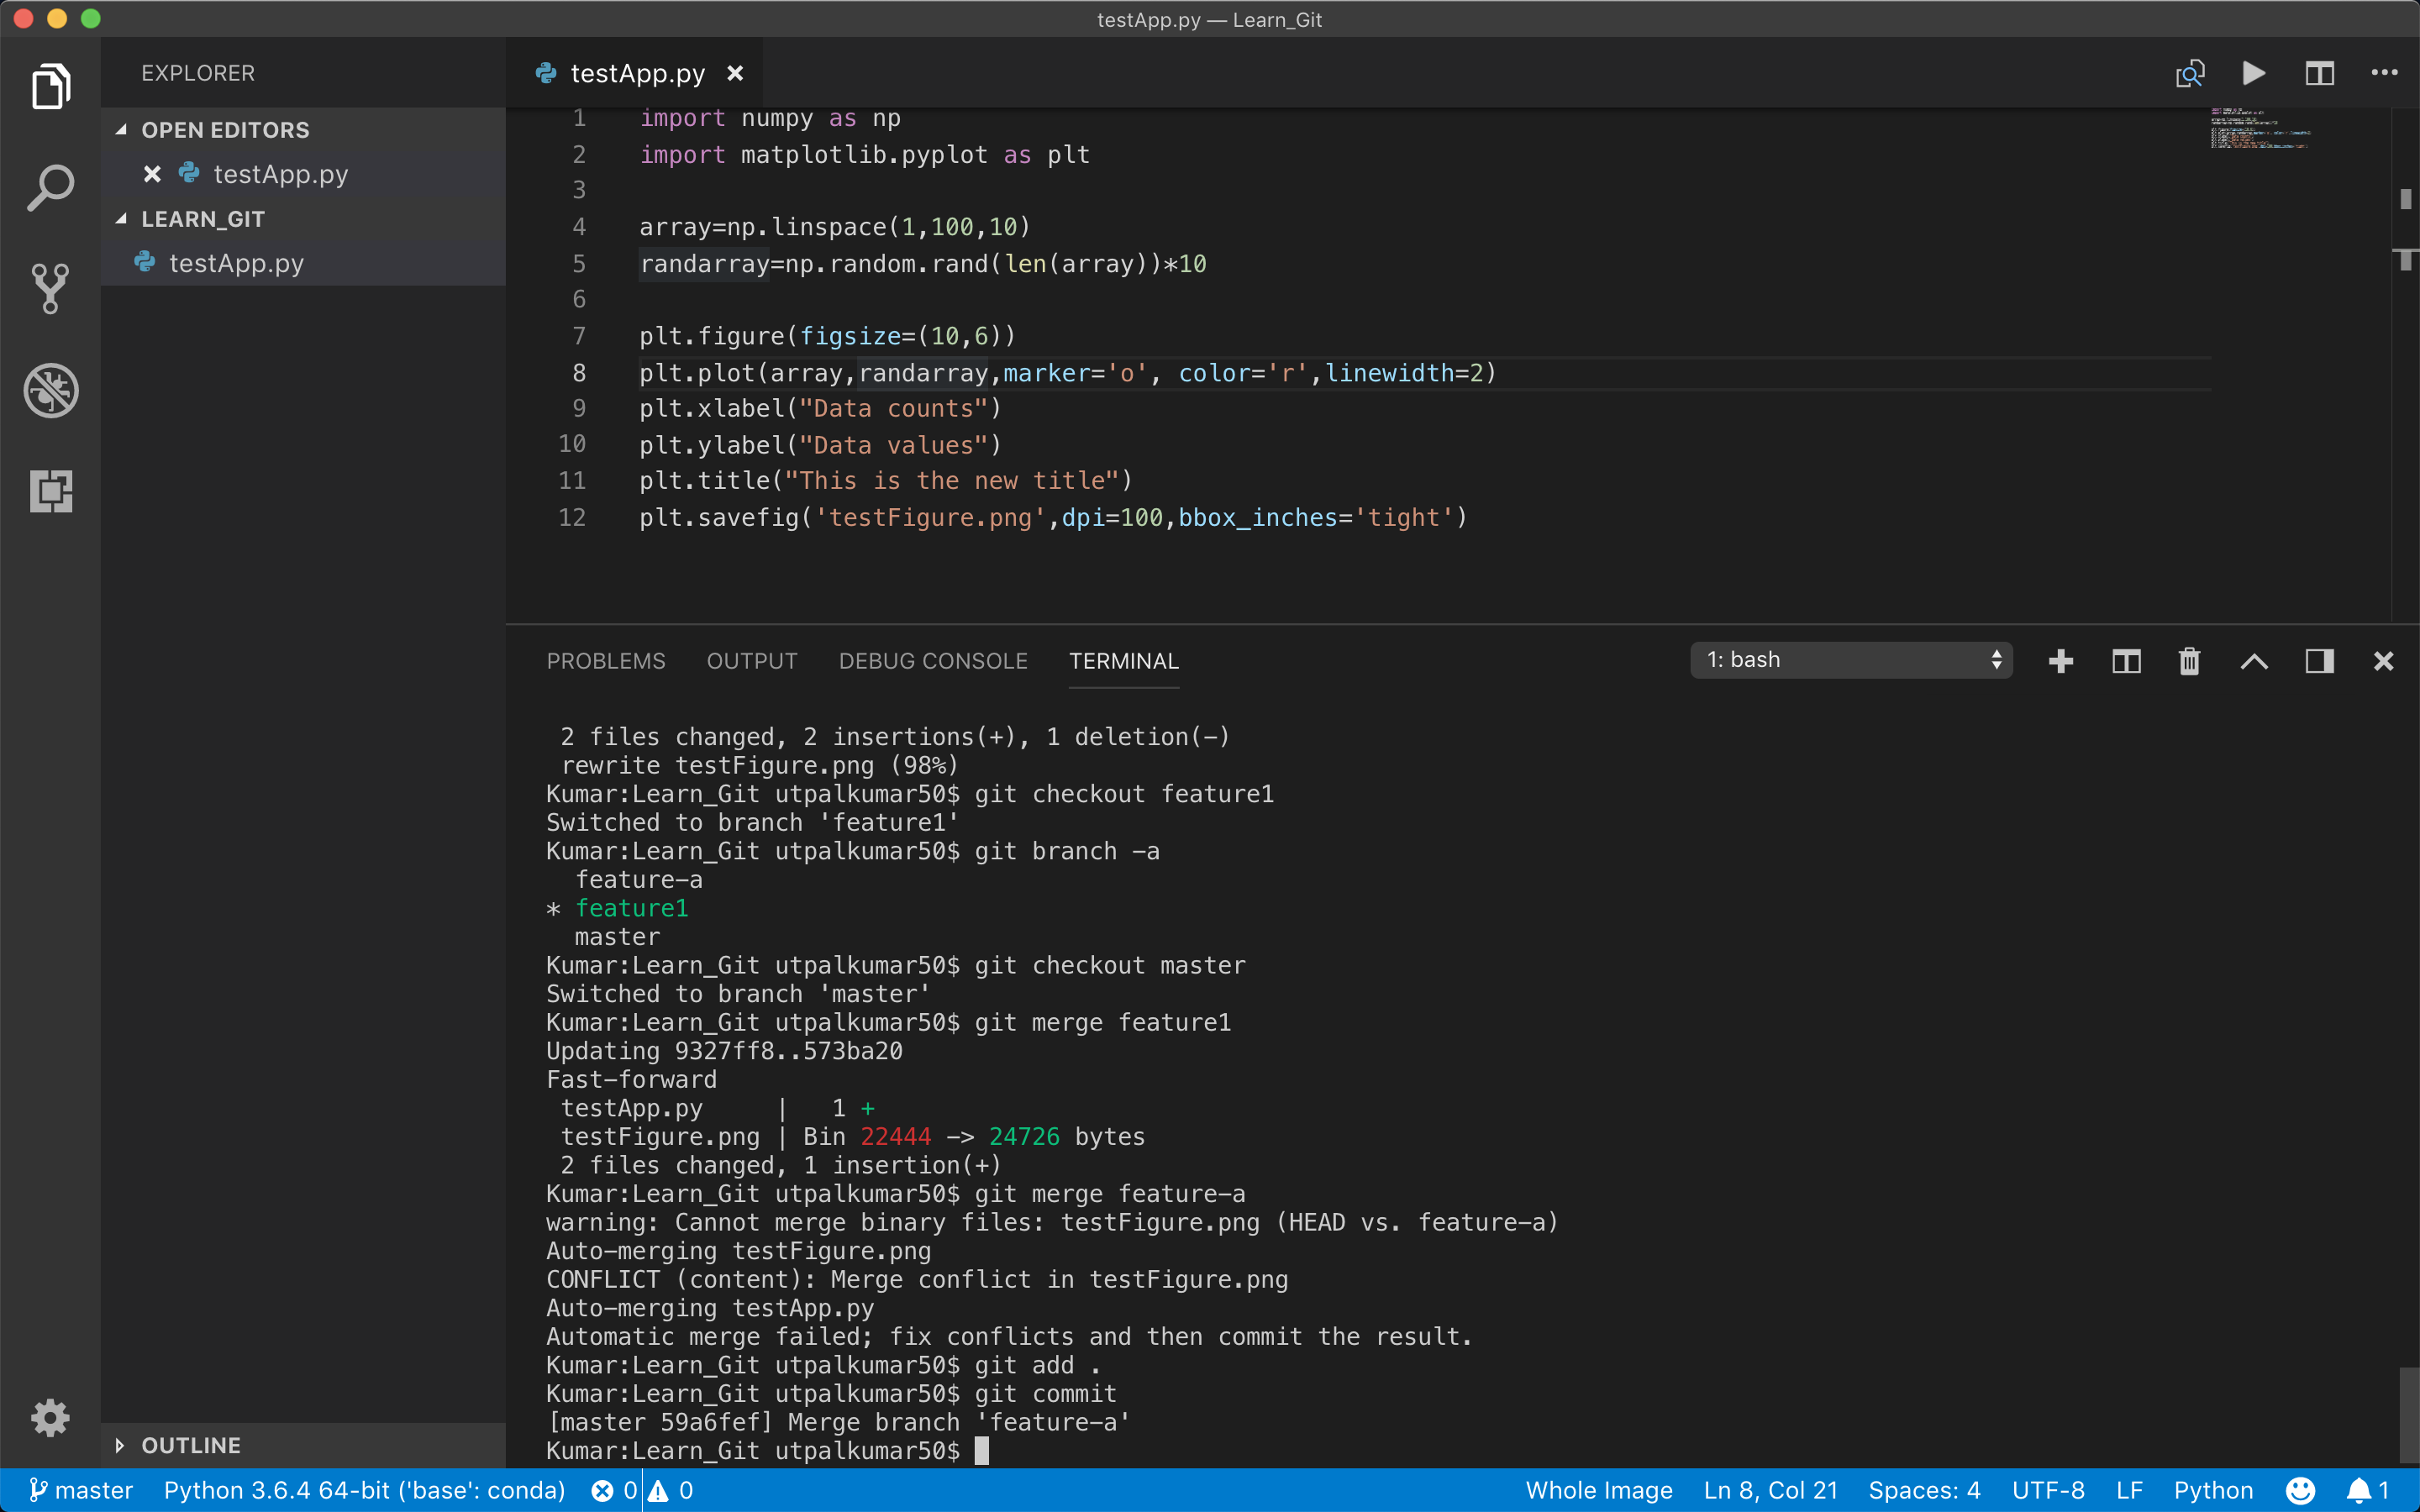
Merging Branches
To merge the branches, we first need to move to the branch into which we wanna merge, which in our case is master branch.
git checkout master
git merge feature1
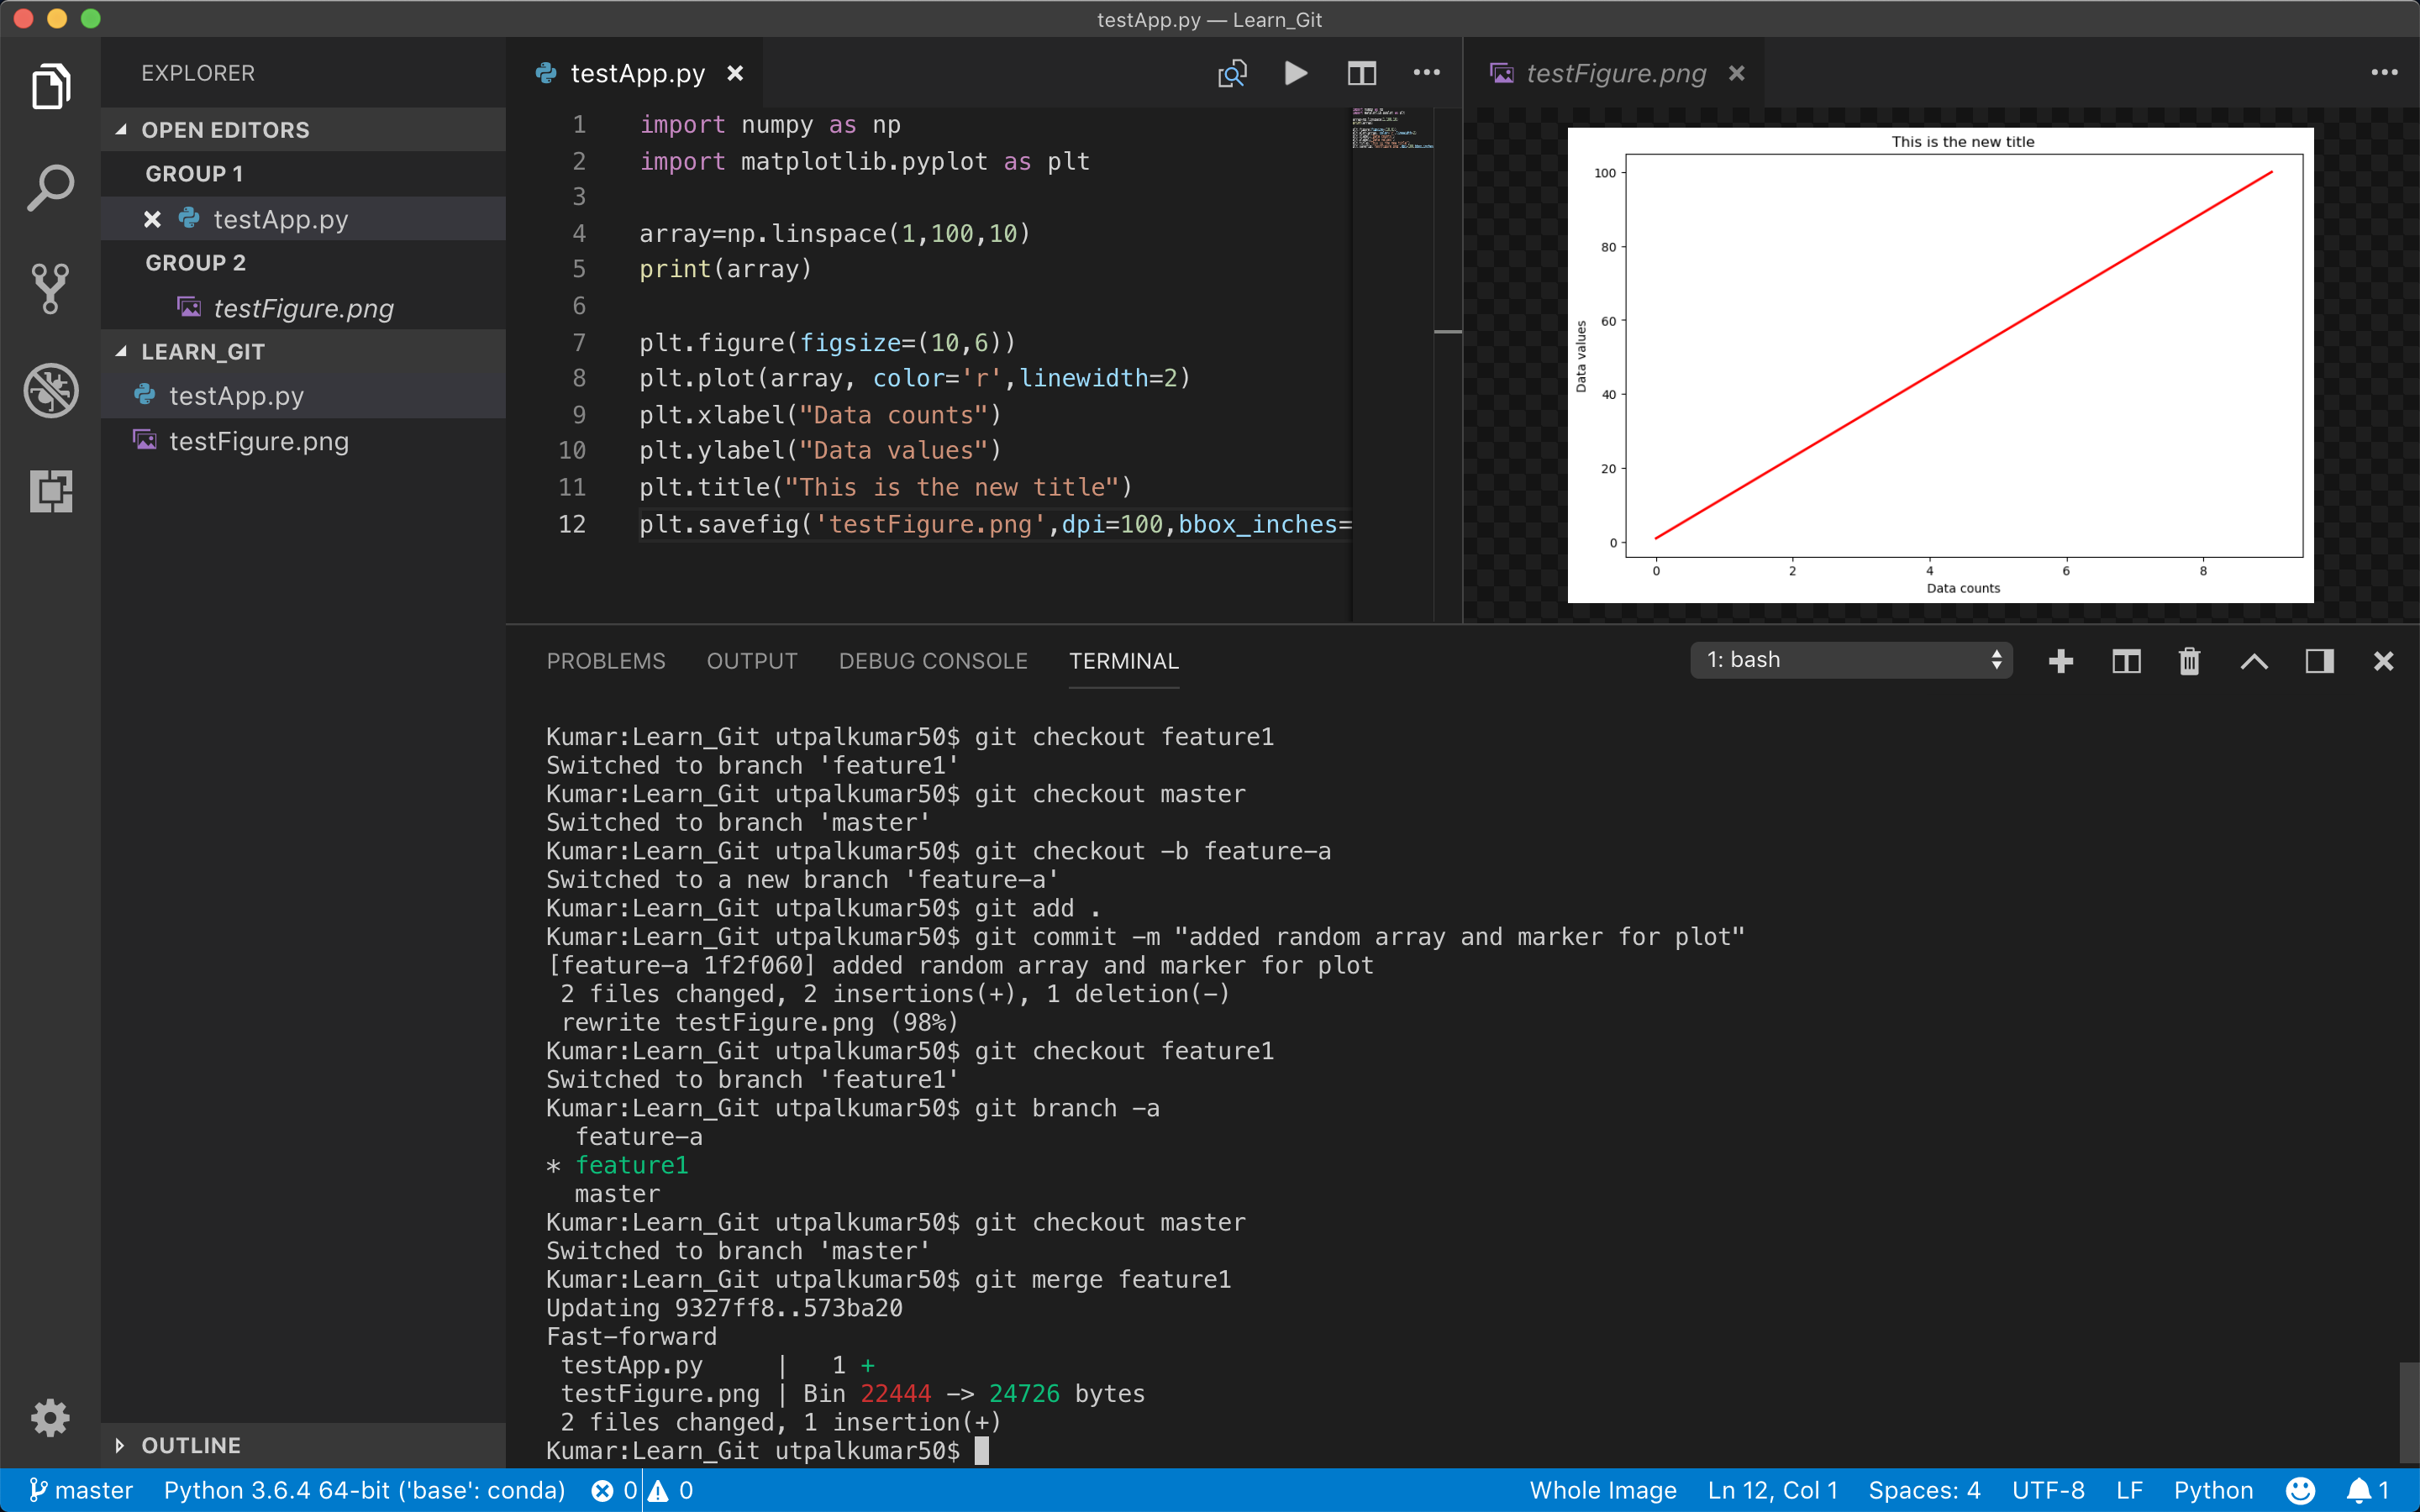
Now, let’s merge the other branch
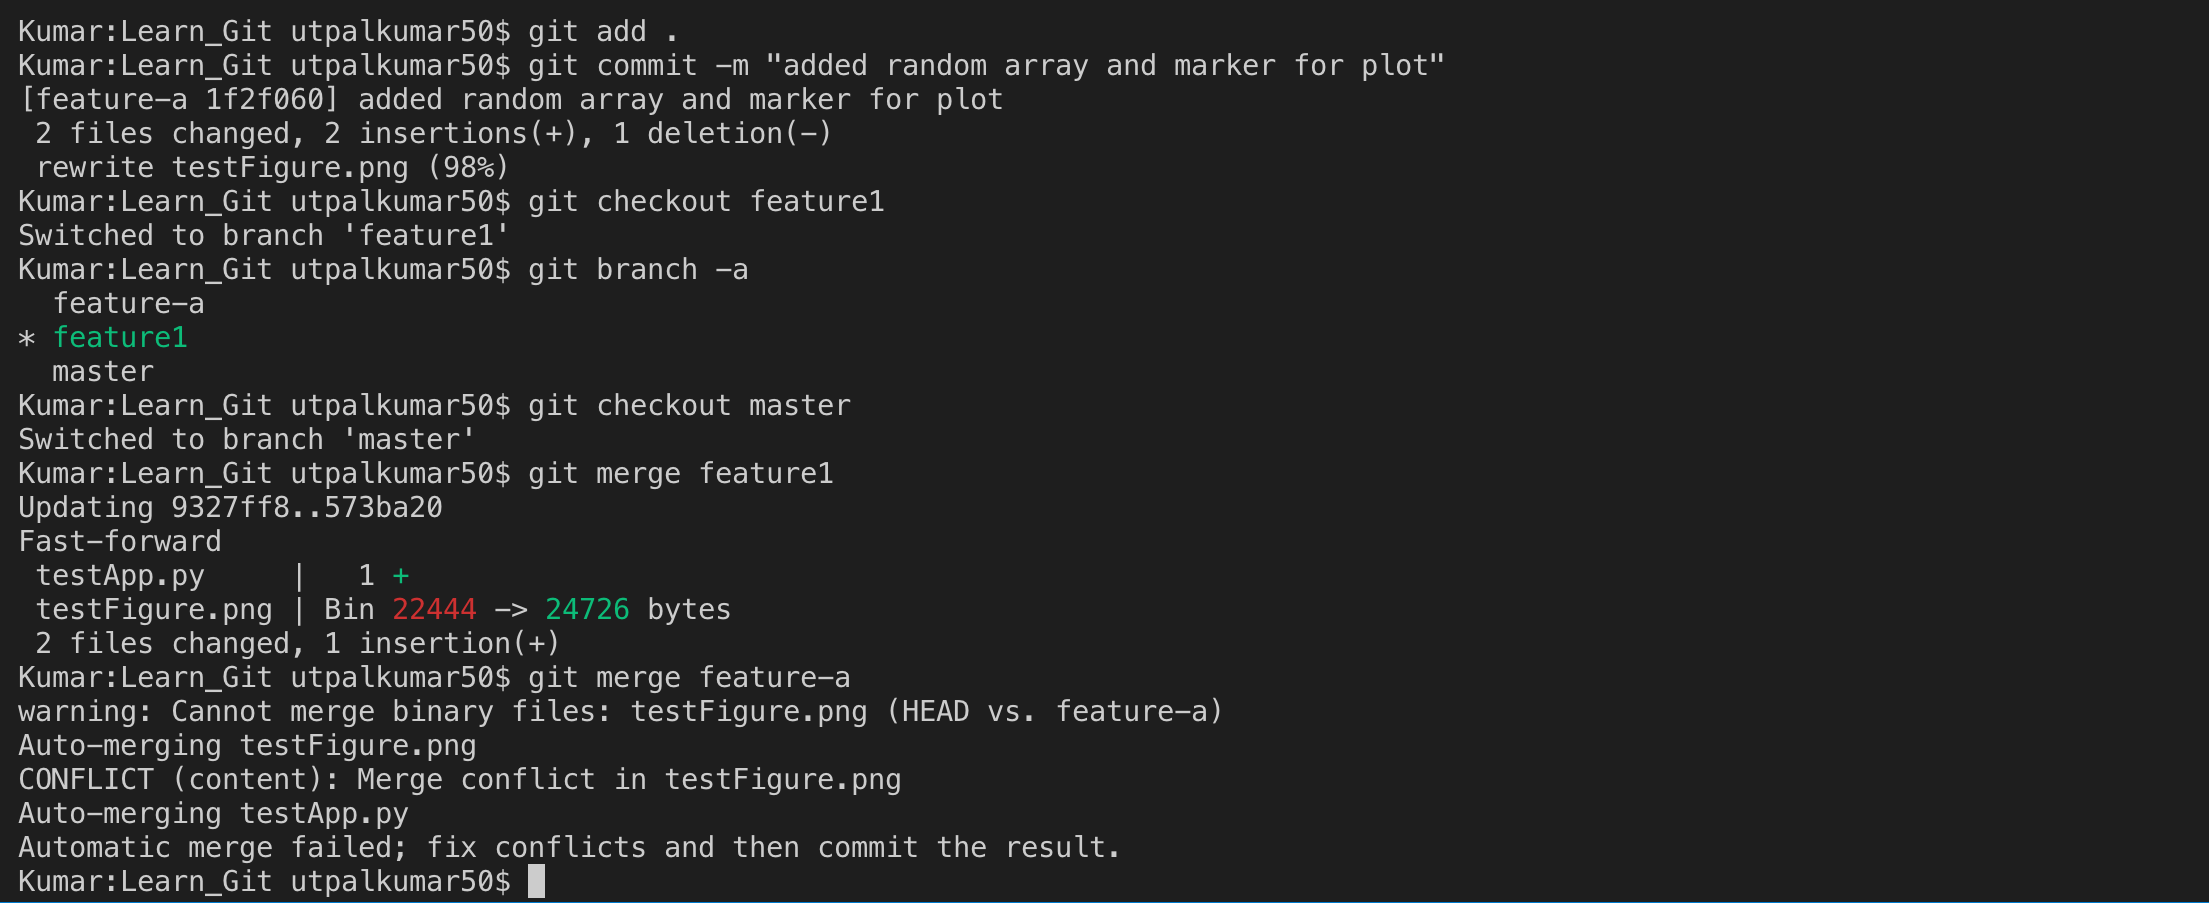
This time, we encounter some conflicts to the merge. In this case, we need to manually fix the conflict and then add the files using
git add .
git commit
Then a vim editor will appear, just save and quit the editor using the command “:wq”.